- Downward sloping RSI and a closing break of 21-DMA favor bears.
- A 5.5-month-old horizontal area becomes near-term strong support to watch.
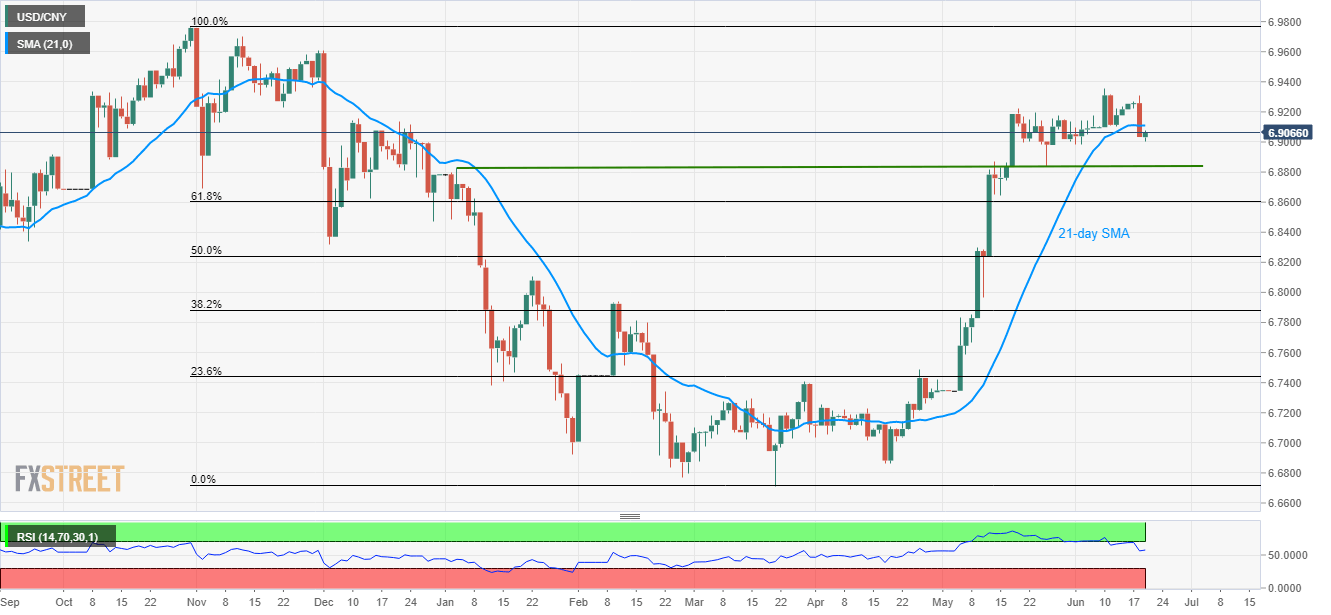
The USD/CNY pair’s sustained downturn below 21-day SMA speaks loud of its weakness despite the latest pullback. The quote presently takes the bids near 6.9065 during early Wednesday.
Should the quote manages to clear 6.9110 level comprising 21-day simple moving average (SMA), 6.9200 and current month high around 6.9360 could mark their presence on the chart.
However, late-November 2018 tops near 6.9610 will be on the bulls’ radar past-6.9360.
On the downside, 6.9000 round-figure could serve as immediate support, a break of which pushes the sellers towards aiming 6.8830/40 horizontal area including early-January high and May month low.
It should also be noted that 14-day relative strength index (RSI) seems taking a U-turn from the overbought region and increases the odds for southward price momentum.
Given the pair refrains from respecting 6.8830 support, 61.8% Fibonacci retracement of October to March decline, surrounding 6.8600. could flash on bear’s list.
USD/CNY daily chart
Trend: Bearish
