- USD/IDR fails to hold onto recovery gains.
- 61.8% Fibonacci retracement, short-term support line and 200-day SMA limit immediate declines.
- The previous year top on the buyers’ radar amid bullish MACD.
USD/IDR declines 0.28% to 14,283 by the press time of early Friday. Even so, the pair remains above short-term key supports while also nearing the multi-month high.
Among them, 61.8% Fibonacci retracement of April 2019 to January 2020 fall, around 14,170, acts as the closest support, a break of which could drag the quote to an ascending trend line since February 20, 2020, currently at 14,095.
In a case where the USD/IDR prices slip below 14,095, 200-day SMA close to 14,055 and 14,000 round-figure become the strong supports to disappoint the sellers.
On the upside, buyers can wait for a sustained break above 14,360 to aim for 14,500 and 14,660.
Though, the bulls’ refrain to step back from 14,660 can the year 2019 high surrounding 14,760.
USD/IDR daily chart
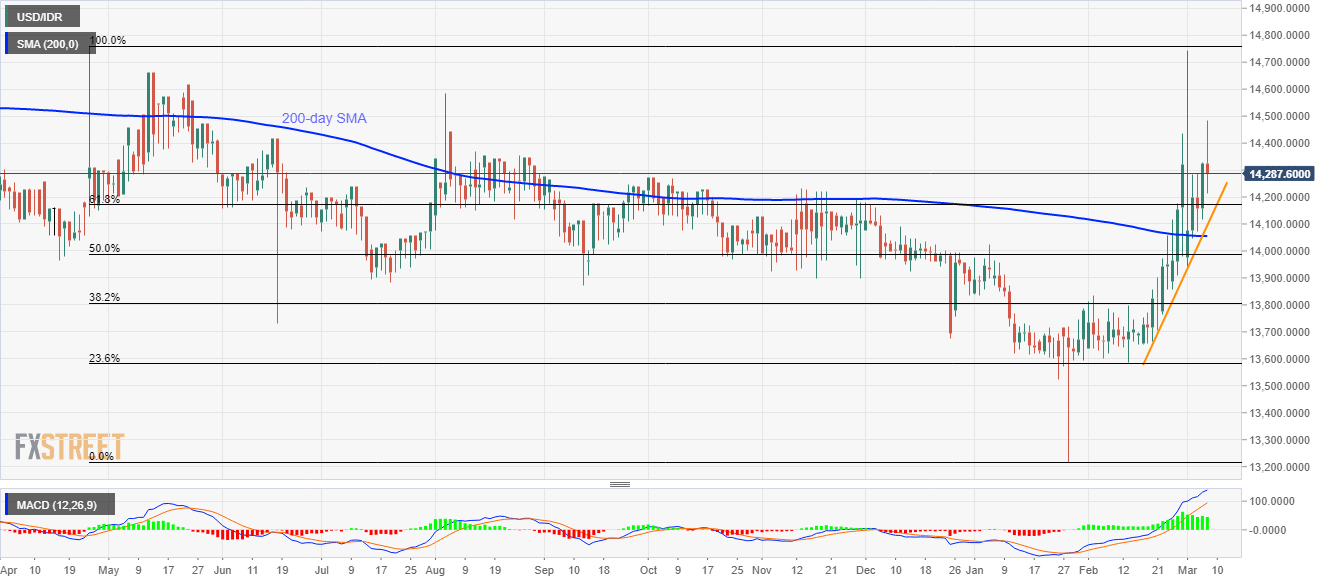
Trend: Bullish
