- USD/IDR remains on the front foot above 23.6% Fibonacci retracement of its rise from late-January.
- The monthly top, also the record high, on the bulls’ radar.
- Sellers will look for a clear break below 50% Fibonacci retracement.
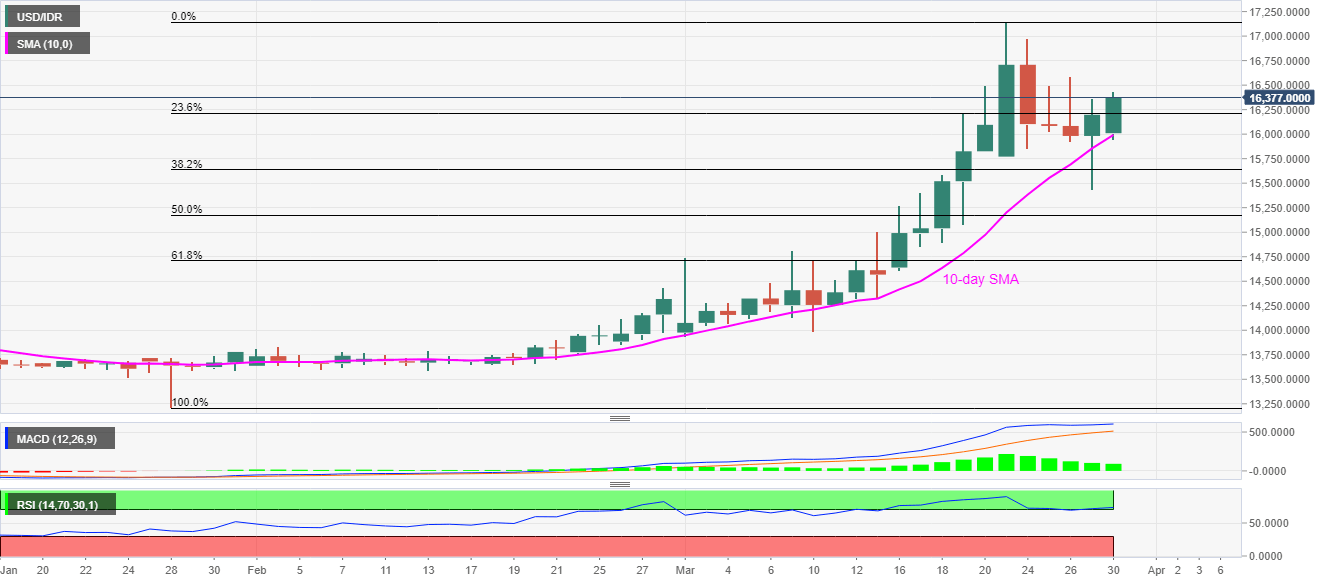
While portraying its bounce off 10-day SMA, USD/IDR takes the bids to 16,390, up 1.27%, by the press time of the pre-Europe session on Monday.
In addition to its sustained U-turn from the short-term key SMA, bullish MACD and a break of 23.6% Fibonacci retracement level also favor the bulls.
Buyers are now targeting Thursday’s top near 16,590 ahead of challenging 17,000 and the record top near 17,150. Though, the pair’s further upside could be questioned by the oversold RSI conditions.
Alternatively, a daily closing below 10-day SMA level of 15,990 could drag prices to March 17 top surrounding 15,400 whereas 50% Fibonacci retracement level near 15,170 could please the bears next.
USD/IDR daily chart
Trend: Bullish
