- USD/IDR remains on the back foot below short-term key resistances.
- 50% Fibonacci retracement is in focus for now.
- Normal RSI conditions, a sustained weakness favor the bears.
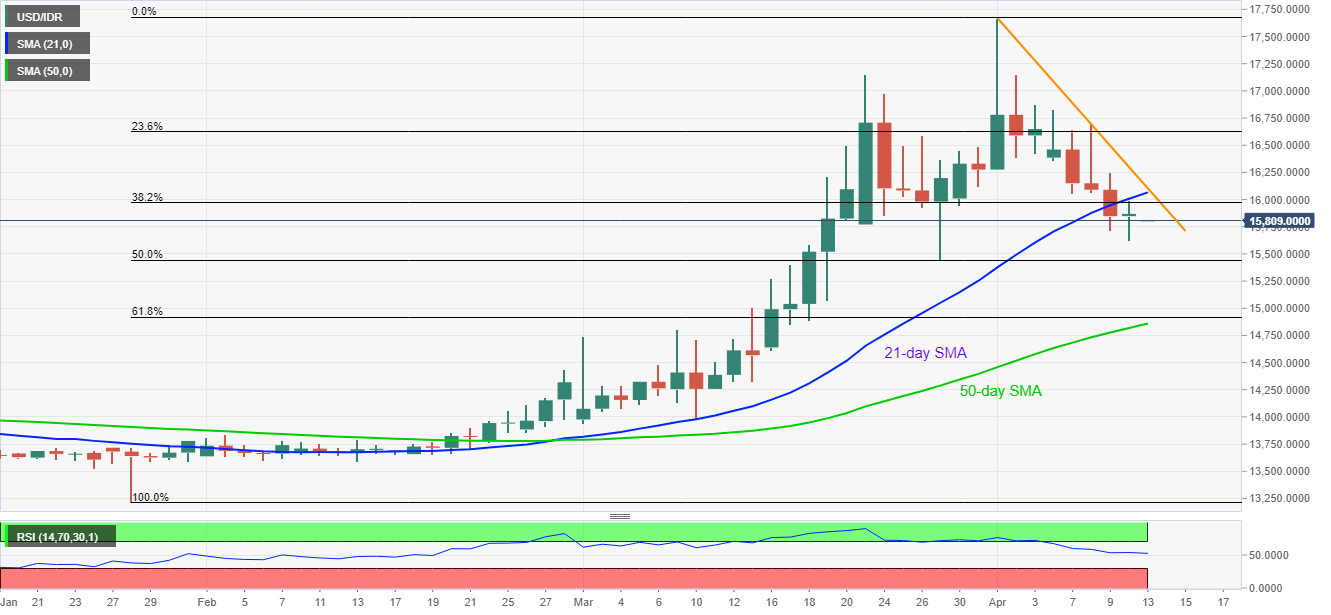
USD/IDR declines 0.40% to 15,806 during the Asian session on Monday. In doing so, the pair extends its weakness below the monthly falling trend line while also stretching the recent drop beneath 21-day SMA.
Considering the pair’s sustained trading below key resistance, coupled with the normal conditions of the RSI, USD/IDR prices are likely to remain weak.
As a result, 50% Fibonacci retracement of January-April upside, near 15,440, could lure the sellers.
Should there be a further downside below 15,440, 61.5% Fibonacci retracement and 50-day SMA, respectively around 14,915 and 14,860, could lure the sellers.
On the upside, a 21-day SMA level of 16,065 and the descending trend line from April 01, currently at 16,105, could keep the pair’s recovery moves under check.
USD/IDR daily chart
Trend: Bearish
