- USD/IDR registers the biggest monthly losses in a year.
- Break of 50-month SMA, 23.6% Fibonacci retracement portrays the pair’s weakness.
- A monthly break below the key support line will extend the south run.
USD/IDR trades near 13,630 during the early Monday. In doing so, the pair extends the declines below 50-month SMA and 23.6% Fibonacci retracement of its broad run-up from August 2011 to October 2018.
The pair now rests on the multi-month-old support trend line stretched from October 2016, currently around 13,600.
As a result, the bears are looking for a monthly break below the key support line to take aim at October 2016 bottom surrounding 12,930. Though, the year 2018 bottom close 13,270 could offer an intermediate halt.
Meanwhile, a pullback from the current levels needs to cross 50-month SMA, at 13,770 now, to revisit 14,000 and August 2019 high near 14,350.
USD/IDR monthly chart
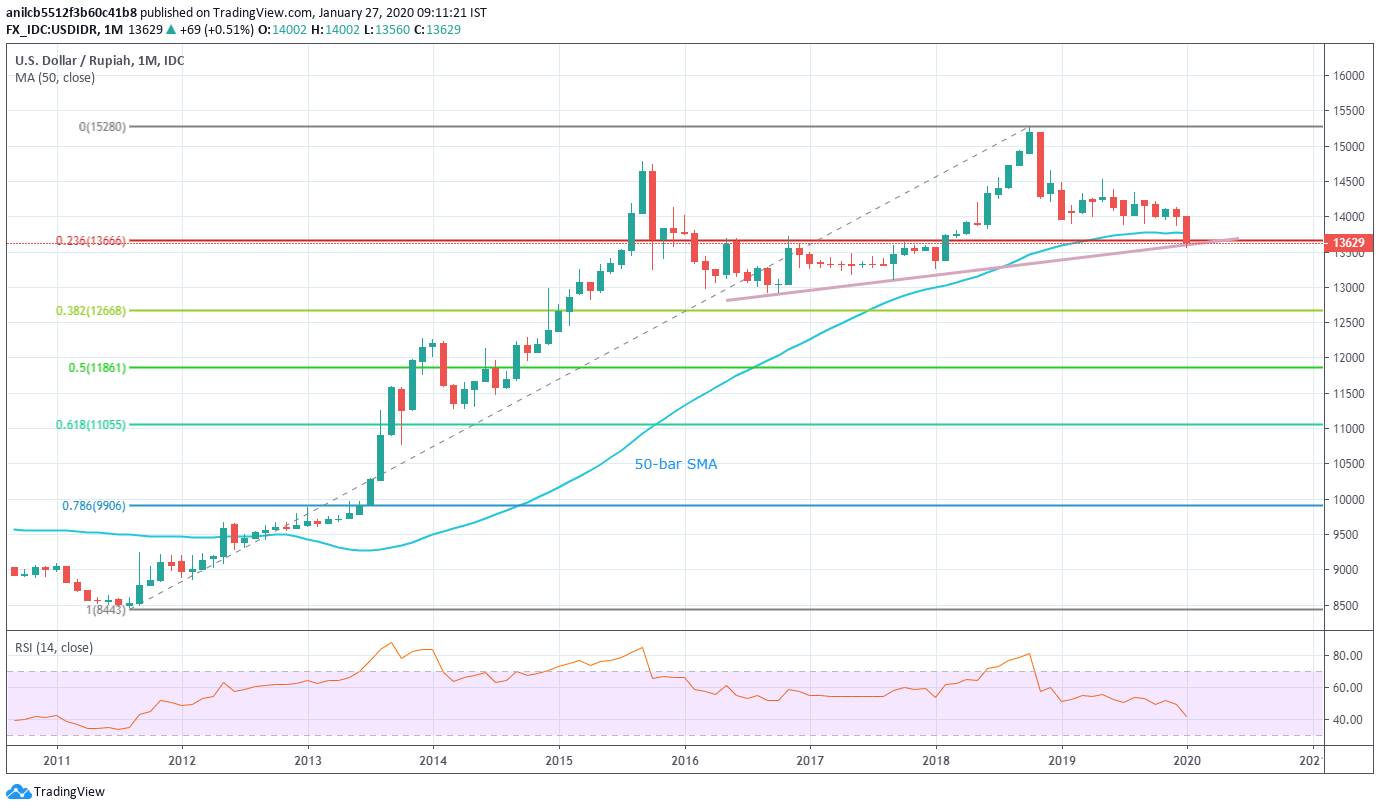
Trend: Pullback expected
