- USD/IDR declines from a multi-month high.
- Lows marked during February/July 2019 can offer intermediate stops to 200-week SMA.
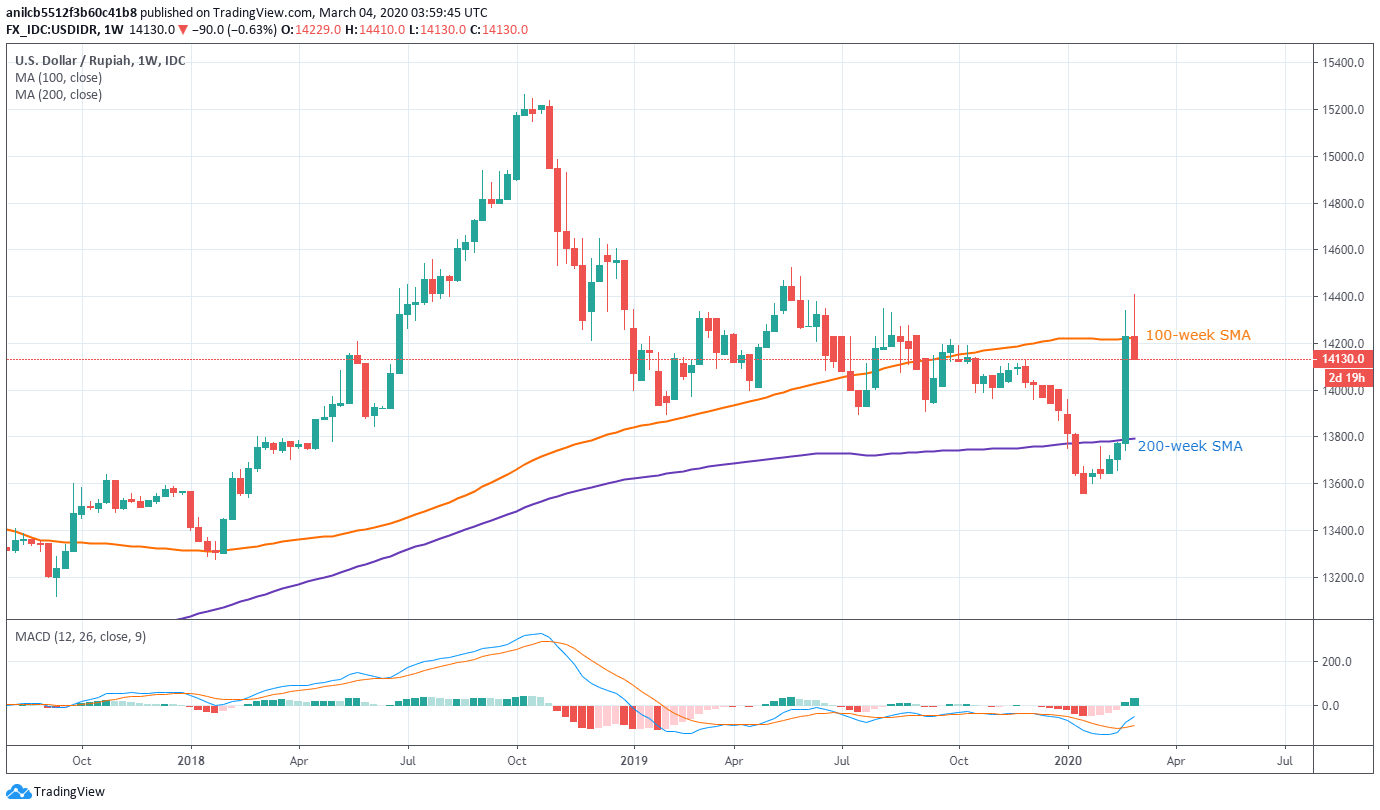
- May 2019 will flash on the bulls’ radars beyond 100-week SMA.
Having failed to cross the May 2019 high, USD/IDR slips below 100-week SMA while declining to 14,130, down 0.47%, during the pre-European session on Wednesday.
The pair now takes rounds to December 2019 peak with 14,000 round-figure acts as the immediate support.
During the quote’s further downside below 14,000, lows marked in February and July 2019, surrounding 13,895, will be the key to watch as a break of which can recall a 200-week SMA level near 13,790.
On the contrary, a sustained break above the 100-week SMA level of 14,226 will enable buyers to again challenge May 2019 peak close to 14,525.
In a case where the bulls manage to dominate past-14,525, multiple highs marked during late-2018 around 14,650 will be on their radars.
USD/IDR weekly chart
Trend: Pullback expected
