- USD/IDR shrugs off the previous day’s decline, turning mildly positive for the week.
- Sustained trading below 13,600 will trigger a fresh round of selling.
- An eight-week-old falling trend line adds to the resistance.
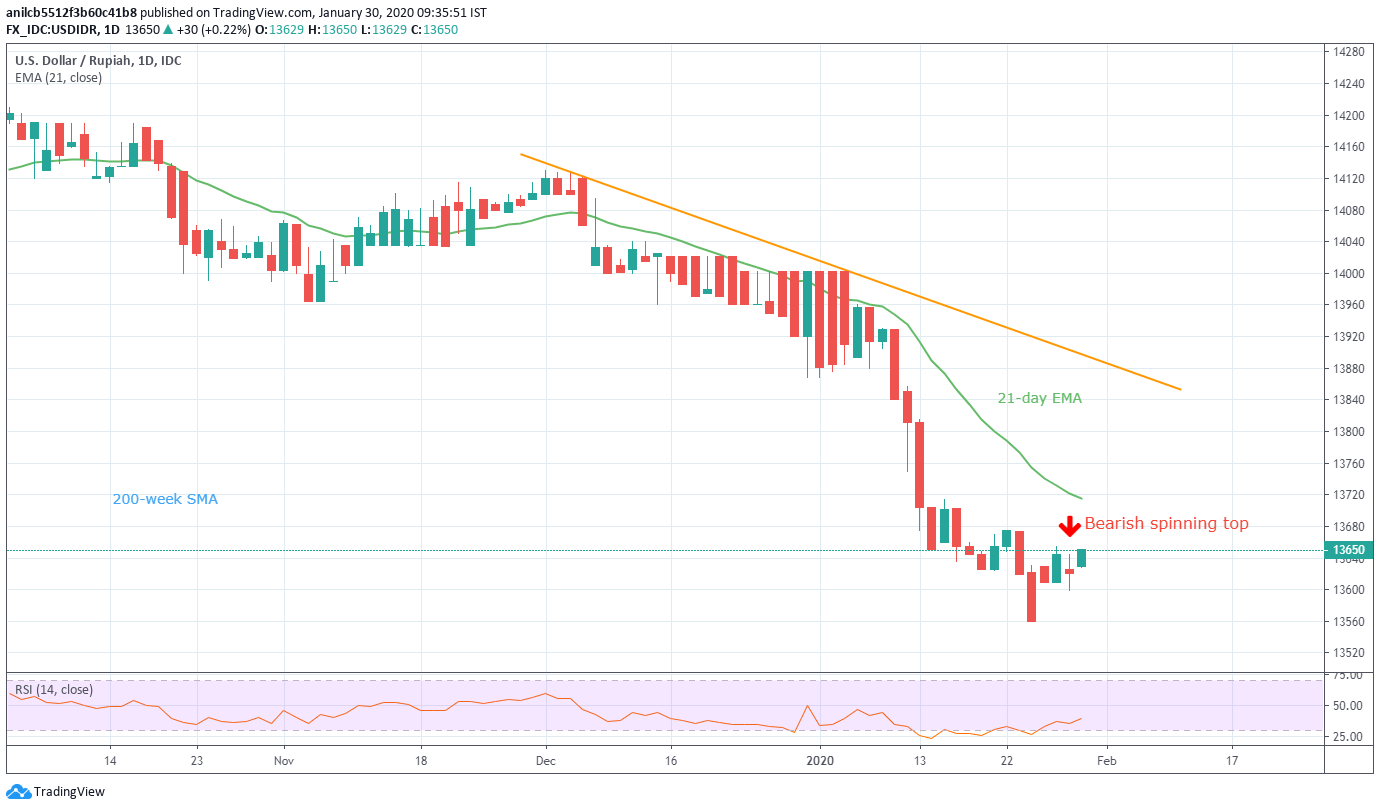
USD/IDR flashes an intraday high of 13,650 ahead of the European session on Thursday. In doing so, the pair ignores the previous day’s bearish spinning top candlestick formation while rising towards 21-day EMA.
Ahead of the 21-day EMA level of 13,715, last week’s top near 13,675 can offer an intermediate halt.
It should, however, be noted that a sustained break of 13,715 will be the key to pair’s run-up towards an eight-week-old resistance line, at 13,900 now.
On the contrary, sellers will look for entry below 13,600 to target the monthly bottom surrounding 13,560. Though, pair’s further declines could aim for 13,450 and the year 2018 bottom close to 13,255.
USD/IDR daily chart
Trend: Further recovery expected

