- USD/IDR drops to the fresh low since February 2018.
- The pair recently ignored a bullish candlestick formation while breaking the medium-term support trend line.
- 50-day SMA, a two-month-old resistance line will challenge buyers during the recovery.
USD/IDR remains favorite to the bears while declining to 13,574 during early Friday. The quote slipped to the fresh low since February 2018 of 13,569 during the Asian session.
In doing so, the quote ignored the bullish Doji candlestick formation portrayed on Thursday as well as broke a downward sloping trend line stretched from September 12, 2019. Also showing the sellers’ dominance is the bearish signal from MACD.
With this, the pair is likely dropping towards the late-October 2017 low near 13,475 whereas January 2018 bottom close to 13,270 could please the bears afterward.
Should the pair closes beyond the support-turned-resistance line, at 13,620 now, on a daily basis, 13,730 and 13,835/40 can entertain buyers.
Though, the pair’s upside beyond 13,840 will be challenged by 50-day SMA and two-month-old resistance line around 13,925/35.
USD/IDR daily chart
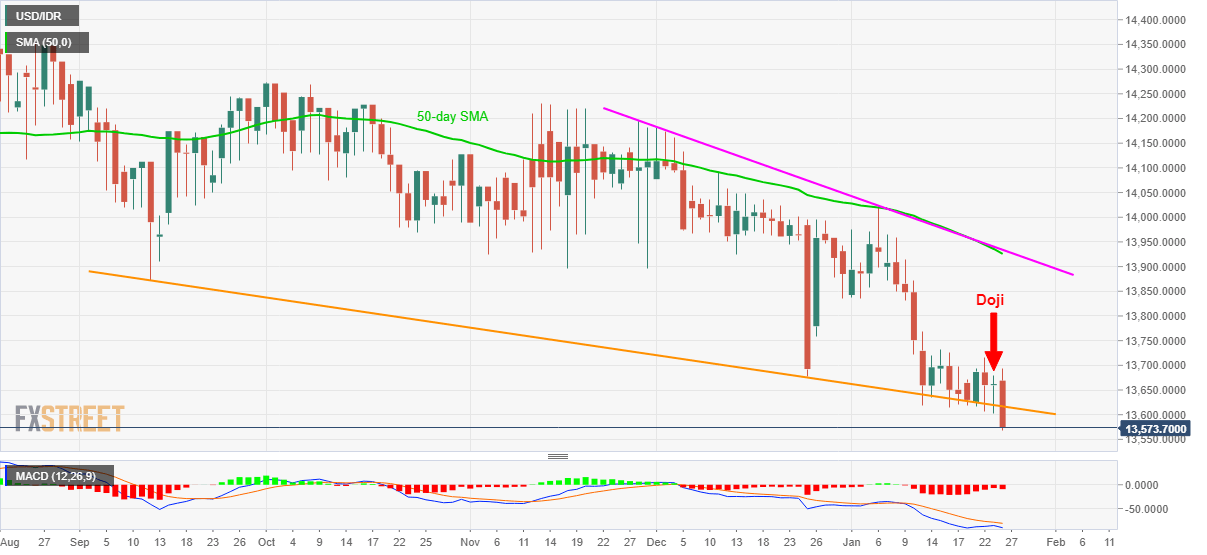
Trend: Bearish
