- USD/IDR remains depressed near the lowest since February 24, 2020.
- Early-February high, a falling trend line from March 20 could lure the bears.
- March 02 top, a two-month-old resistance restrict the pair’s immediate upside.
- Oversold RSI conditions increase the odds of a pullback from a multi-day low.
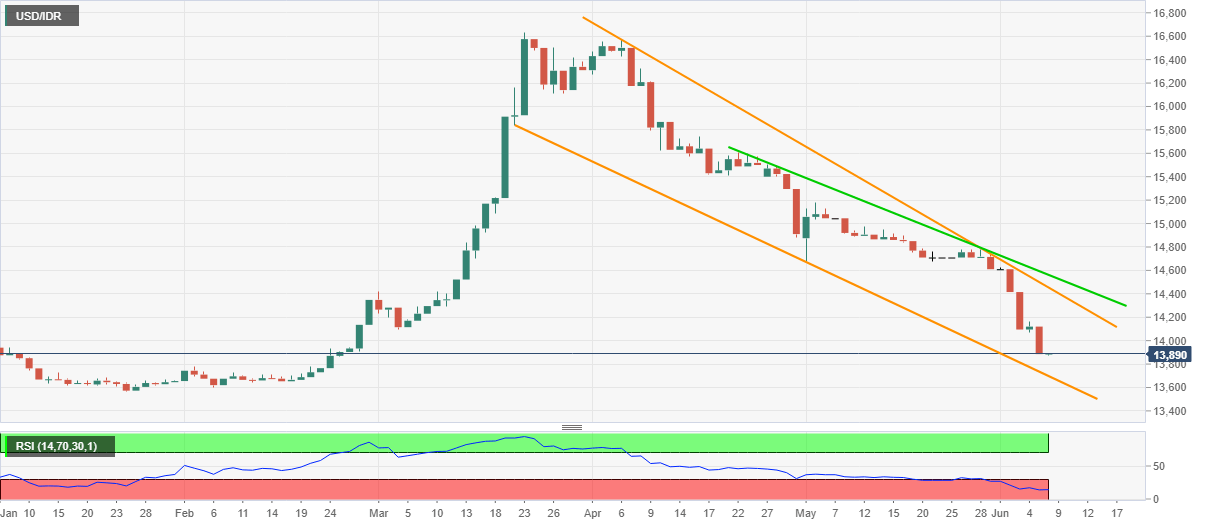
USD/IDR stays on the back foot around 13,890, the lowest since late-February, during the initial trading session on Monday.
While oversold RSI conditions suggest the pair’s bounce, a descending trend line from April 06 restricts the upside attempts. Even so, the quote’s U-turn to Mach 02 peak, near 14,420 can’t be ruled out.
If at all the USD/IDR prices manage to extend the recovery moves beyond the multi-day-old resistance line, at 14,455 now, another falling resistance line from April 22, currently around 14,560, will be the key to watch.
Alternatively, February 04 high of 13,775 may act as immediate support during the pair’s further declines.
However, a downward sloping trend line from March 20, at 13,697 now, could challenge the bears afterward.
USD/IDR daily chart
Trend: Pullback expected
