- USD/IDR remains on the front foot.
- Break of 23.6% Fibonacci retracement, bullish MACD keep the upside momentum intact.
- Sellers will look for entry below 38.2% Fibonacci retracement.
USD/IDR takes the bids to 14,930 by the press time of early Monday. In doing so, the pair clears 23.6% Fibonacci retracement of its rise from September 2017 to October 2018.
As a result, traders will now keep eyes on 15,000 round-figure as an immediate resistance ahead of challenging the late-October 2018 low near 15,110.
In a case where the bulls remain dominant past-15,110, the year 2018 high near 15,430 will be in the spotlight.
On the downside, 38.2% Fibonacci retracement near 14,535 acts as immediate support.
During the pair’s additional weakness past-14,535, multiple supports around 14,350 and 50% Fibonacci retracement level of 14,260 could please the sellers.
USD/IDR weekly chart
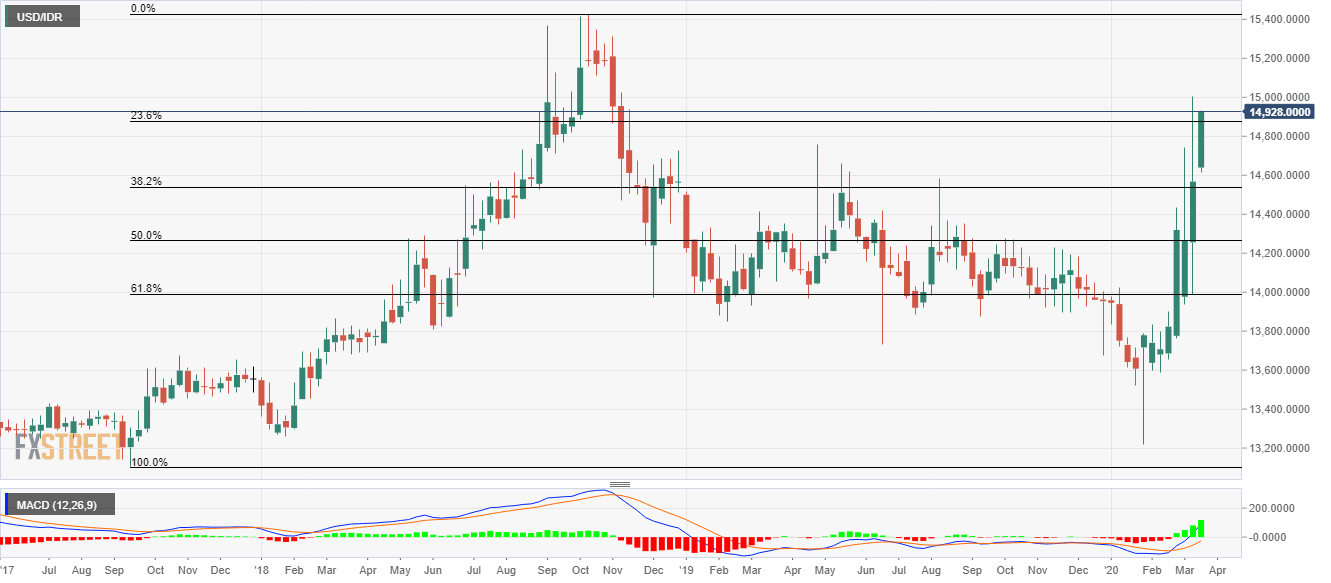
Trend: Bullish
