- USD/IDR holds onto recovery gains after witnessing a pull back from the multi-week top.
- Buyers again attack 50% Fibonacci retracement in search of May 2019 top.
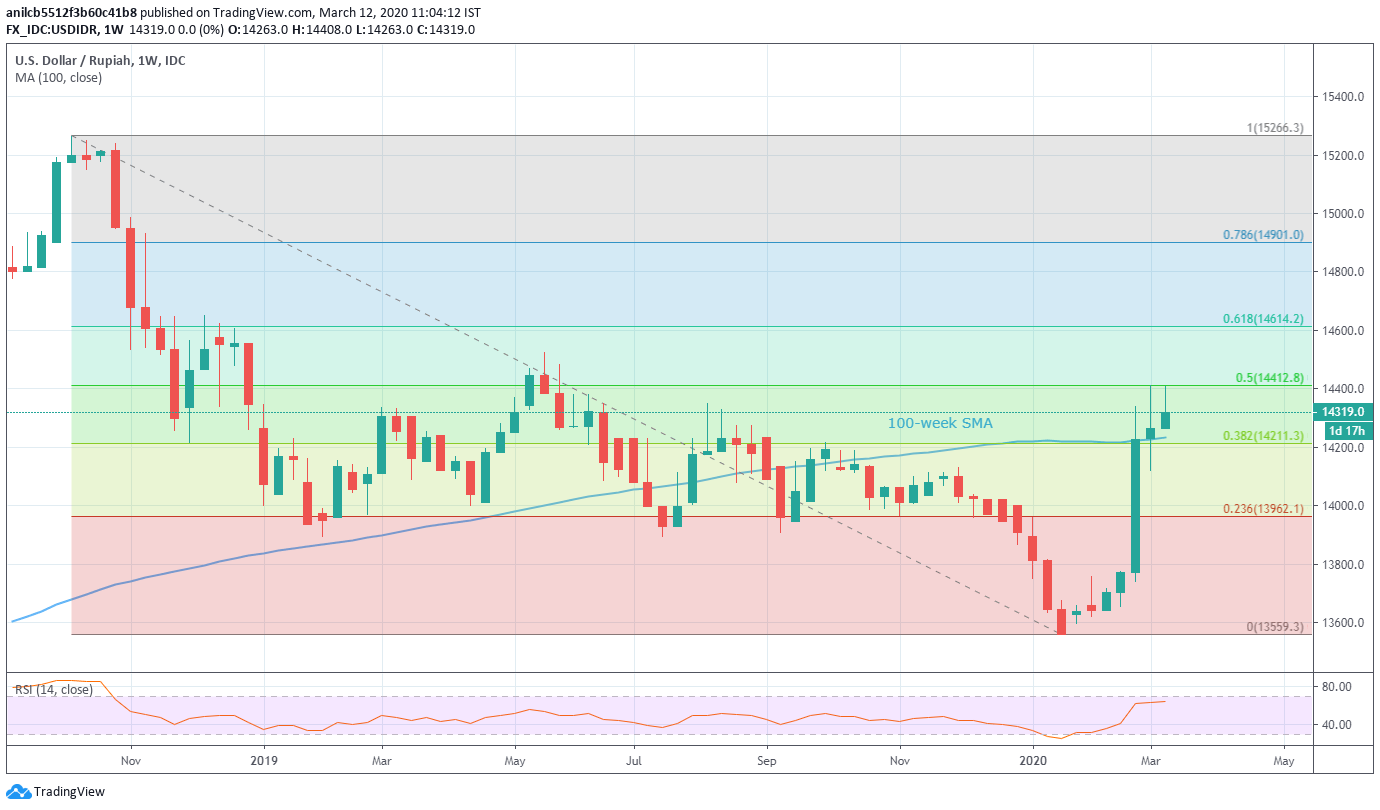
- Sellers can aim for December 2019 high below 100-week SMA.
USD/IDR registers 0.85% gains to 14,320 during the pre-European session on Thursday. The pair remains positive above 100-week SMA while targeting 50% Fibonacci retracement of its declines between October 2018 and January 2020.
May 2019 high near 14,525 can offer intermediate halt to the pair’s run-up towards 61.8% Fibonacci retracement of 14,615 and December 2018 peak close to 14,650.
On the downside, a weekly closing below 100-week SMA level of 14,230 can drag the quote to 38.2% Fibonacci retracement level of 14,210 whereas December 2019 high near 14,010 can please the bears next.
It’s worth mentioning that the pair’s extended fall below 14,000 round-figure can take rest around 13,900 mark including February 2019 low.
USD/IDR weekly chart
Trend: Bullish
