- USD/IDR stays positive above 200-day SMA, key resistance line (now support).
- August month’s tops are on the bulls’ radars.
- Overbought RSI might trigger the pair’s pullback.
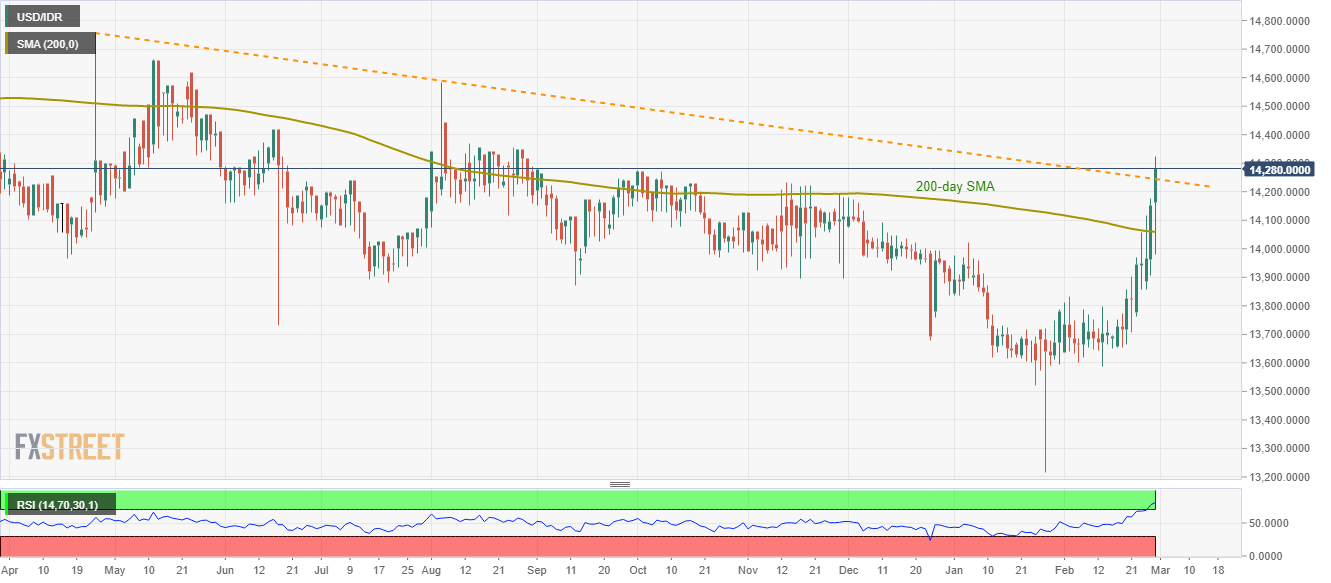
USD/IDR currently takes the bids to 14,270, up 0.83%, following its fresh six-month top of 14,324 marked during the early Friday. That said, the pair recently crossed a downward sloping trend line from April 2019 while also extending its run-up beyond 200-day SMA.
Even so, overbought RSI conditions are challenging any further upside, which if ignored could push the buyers towards August 13 high around 14,370.
Given the Bulls’ dominance past-14,370, August 2019 high near 14,580 and tops marked in May 2019, around 14,660, will be in the spotlight.
On the contrary, the pair’s pullback moves below the resistance-turned-support line of 14,240 can highlight the 200-day SMA level of 14,060 and 14,000 for sellers.
Should there be a further decline below 14,000, the early-month top near 13,830 can return to the charts.
USD/IDR daily chart
Trend: Pullback expected
