- USD/IDR recedes from the key EMA for the sixth time in last one week.
- 21-day EMA, monthly support line on the bears’ radar.
- 61.8% Fibonacci retracement level of January-April rise adds to the upside barriers.
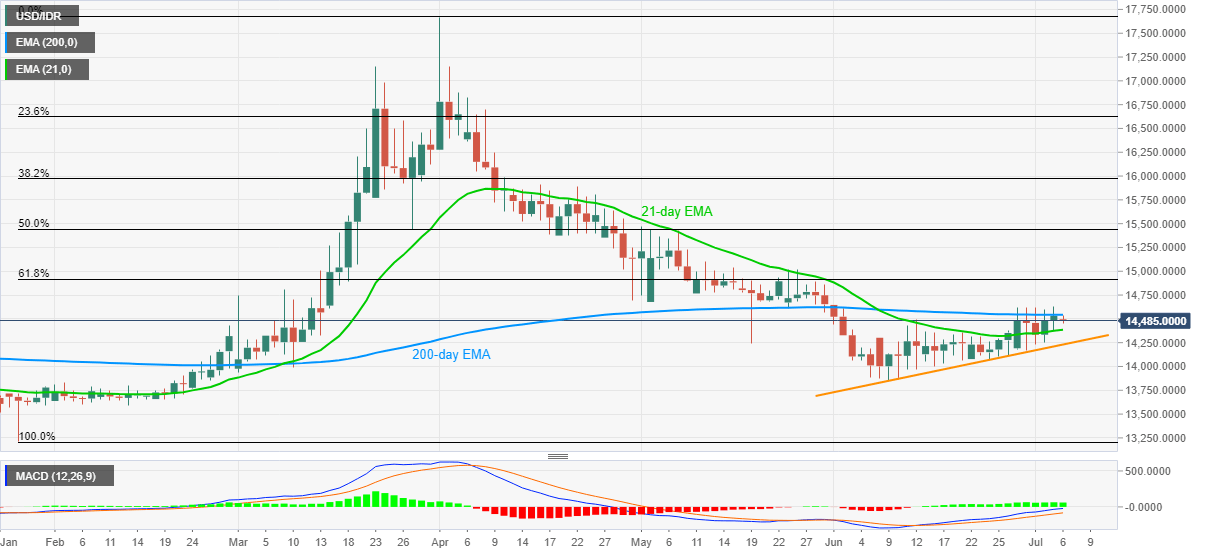
USD/IDR prints 0.35% intraday losses while declining to 14,483 during the early Monday morning in Asia. The quote’s latest weakness marks another failure to cross 200-day EMA despite bullish MACD signals. As a result, sellers are rolling up their sleeves for fresh entries.
Though, a 21-day EMA level of 14,384, followed by an ascending trend line from June 09, at 14,230 now, offers strong downside support to the pair.
Should there be a clear south-run below 14,230, 14,000 round-figures and the June month low near 13,850 will return to the charts.
On the upside, the quote’s rise past-200-day EMA level of 14,543 won’t be enough to recall the buyers. The reason is the pair’s repeated pullbacks below the 14,630/35 area. Also likely to challenge the bulls will be the May 04 low near 14,680.
In a case where the USD/IDR prices manage to cross 14,680 on a daily closing basis, 61.8% Fibonacci retracement level of 14,915 and 15,000 threshold can regain the market attention.
USD/IDR daily chart
Trend: Pullback expected
