- USD/IDR struggles to extend the bounce off 100-day EMA.
- 50-day EMA limits immediate upside.
- 61.8% Fibonacci retracement adds to the support.
- Indonesia Q1 2020 GDP expected to recover on a QoQ basis.
Despite flashing 0.20% gains on a day, USD/IDR struggles to keep the gains while taking rounds to 15,090 during Tuesday’s pre-European session. The cautious moves could be attributed to the upcoming Indonesian GDP figures.
Indonesia’s first quarter (Q1) 2020 GDP is expected to recover to -1.27% from -1.74% prior figures on QoQ basis. However, the yearly forecasts suggest a 4.04% growth versus 4.97% previous.
Additionally, the 50% Fibonacci retracement of February-March upside and 50-day EMA, respectively near 15,120 and 15,270, also limit the pair’s recovery moves.
As a result, sellers will look for an entry during the fresh downside while targeting a re-test of 100-day EMA, at 14,875.
Though, 61.8% Fibonacci retracement, at 14,760, becomes the key during the further south-run as a daily closing below that can recall early-March top near 14,420.
USD/IDR daily chart
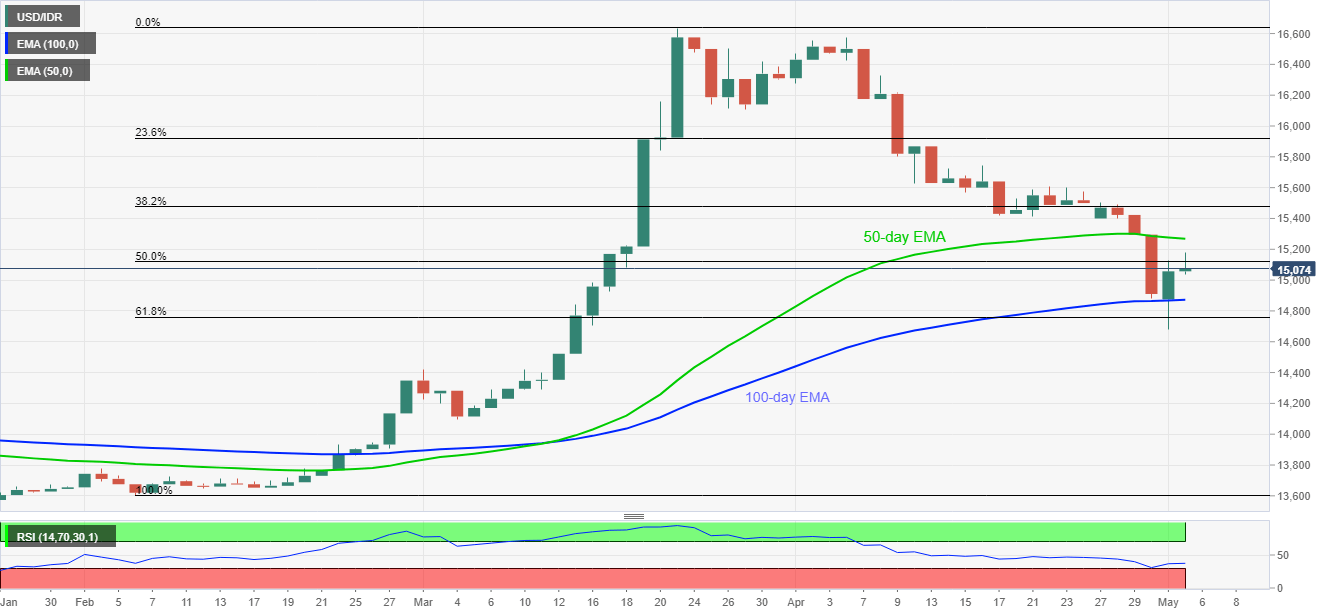
Trend: Bearish
