- USD/IDR prints mild losses while stepping back from 14,313.
- Bears keep the throne unless breaking 200-bar SMA.
- The monthly low, early-February top will lure sellers below the triangle.
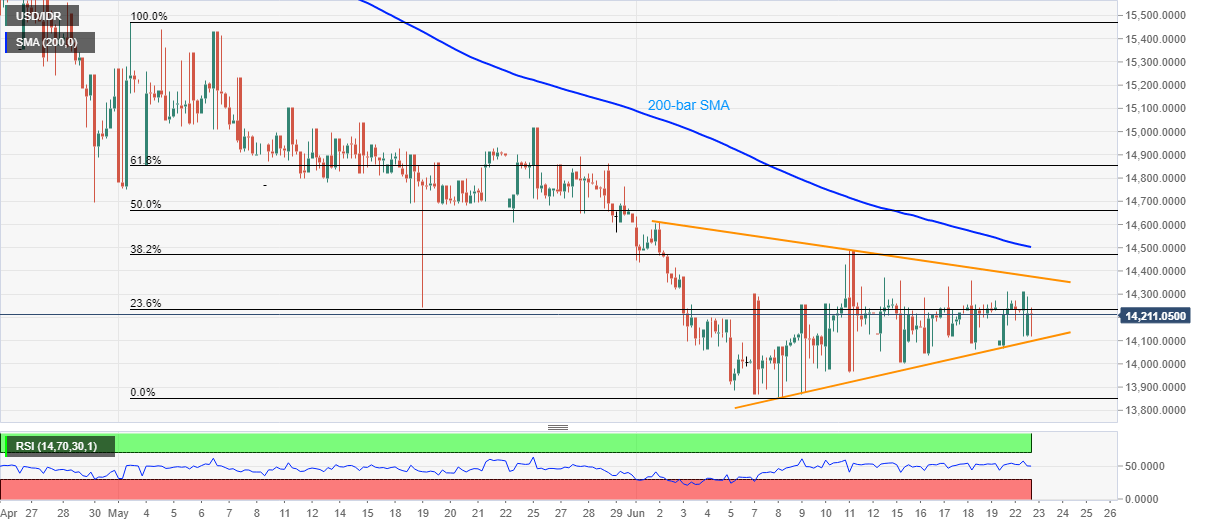
USD/IDR stays offered while trading around 14,210, down 0.15% on a day, during the pre-European session on Tuesday. The pair recently bounced off the intraday low of 14,116 but stays inside a one-month-old triangle formation below 200-bar SMA.
As a result, current expectations of the pair’s pullback towards the pattern’s resistance, at 14,375 now, might find an intermediate hurdle around 14,320.
Should the USD/IDR prices manage to cross 14,375, a 200-bar SMA level of 14,503 becomes the key as it holds the gate for the pair’s further rise towards 50% Fibonacci retracement of May-June fall, near 14,660.
On the flip side, the said triangle’s support around 14,100, followed by 14,000 threshold, will offer nearby rest during the quote’s weakness.
Though, a sustained drop below 14,000 will strengthen the bears to challenge the monthly low near 13,850 ahead of targeting the February 04 top surrounding 13,835.
USD/IDR four-hour chart
Trend: Bearish
