- USD/IDR stays below key moving averages despite bullish MACD.
- A pullback can revisit 23.6% Fibonacci retracement while an upside break may challenge 14,340/50 supply-zone.
Following its positive closing on the previous-day, mainly based on the Bank Indonesia’s (BI) rate cut, USD/IDR trades near 14,100 during the Asian session on Friday.
Bullish signal by 12-day moving average convergence and divergence (MACD) indicator paves the way for the pair’s another confrontation to the 14,190/200 area including the 100-day and 200-day simple moving averages (DMA).
Should the pair manages to cross the key upside barrier, its rally towards 14,340/50 region comprising multiple highs marked in late-August and 61.8% Fibonacci retracement of April-June decline will be challenged.
Meanwhile, 14,040 and 23.6% Fibonacci retracement around 13,970 could entertain sellers during the pullback ahead of challenging them with a horizontal-line around 13,880.
USD/IDR daily chart
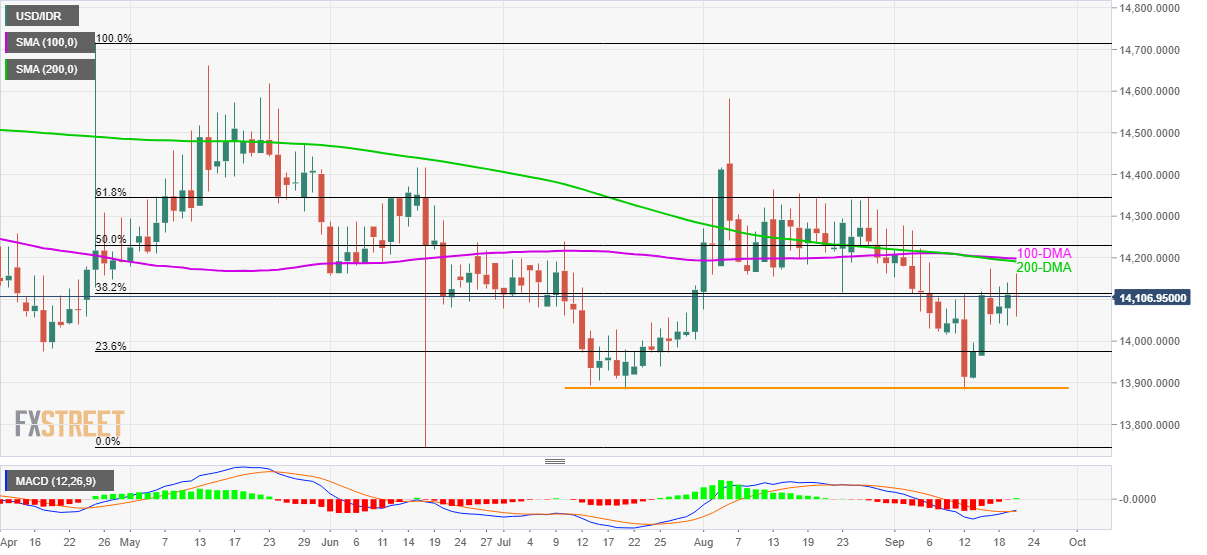
Trend: sideways
