- Unless clearing 100-day SMA chances of 14,090 comeback can’t be denied.
- 14,335 and 200-day SMA adds to the resistance list during the extended rise.
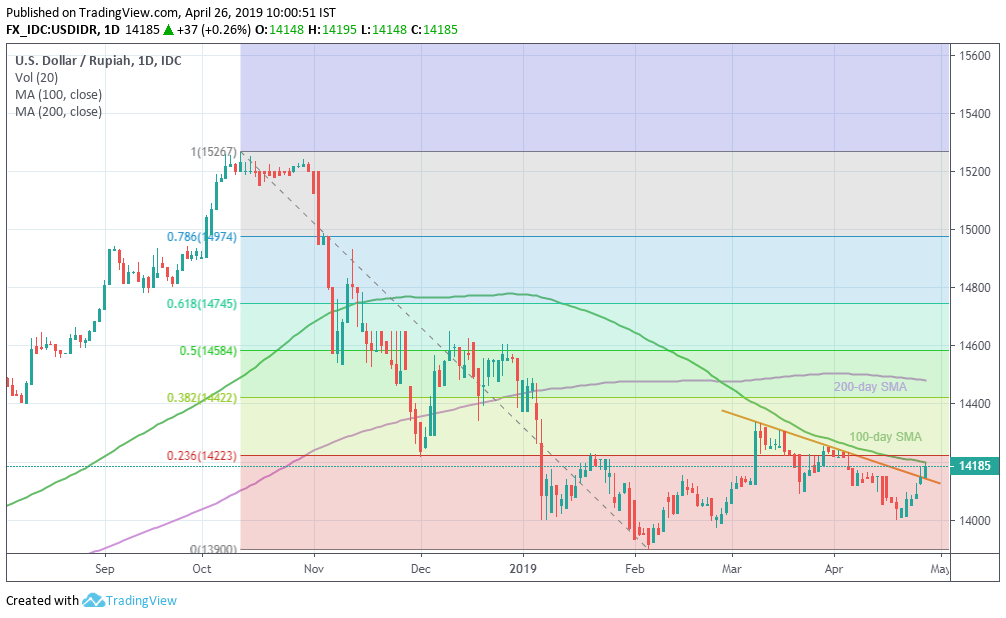
Despite clearing seven weeks long descending trend-line resistance, the USD/IDR pair still struggles under 100-day simple moving average (SMA) level of 14,200 during early Friday.
With this, chances of its pullback to 14,090 can’t be denied if the quote slips beneath 14,150 resistance-turned-support line.
Also, pair’s extended downturn past-14,090 can be challenged by 14,000 round-figure, which if broken can recall February month lows near 13,895.
On the contrary, an upside clearance of 100-day SMA level of 14,200 opens the door for the pair rise to March highs near 14,335 and then to 14,400 whereas 200-day SMA level of 14,485 could cap the following rise.
In a case where the quote crosses 14,485 resistance, 14,600 could be targeted if holding long positions.
USD/IDR daily chart
Trend: Pullback expected
