- USD/IDR offers fewer moves while staying below 100-week SMA.
- July/September lows, 200-week SMA limit pair’s downside.
- 50% of Fibonacci retracement adds to the resistance.
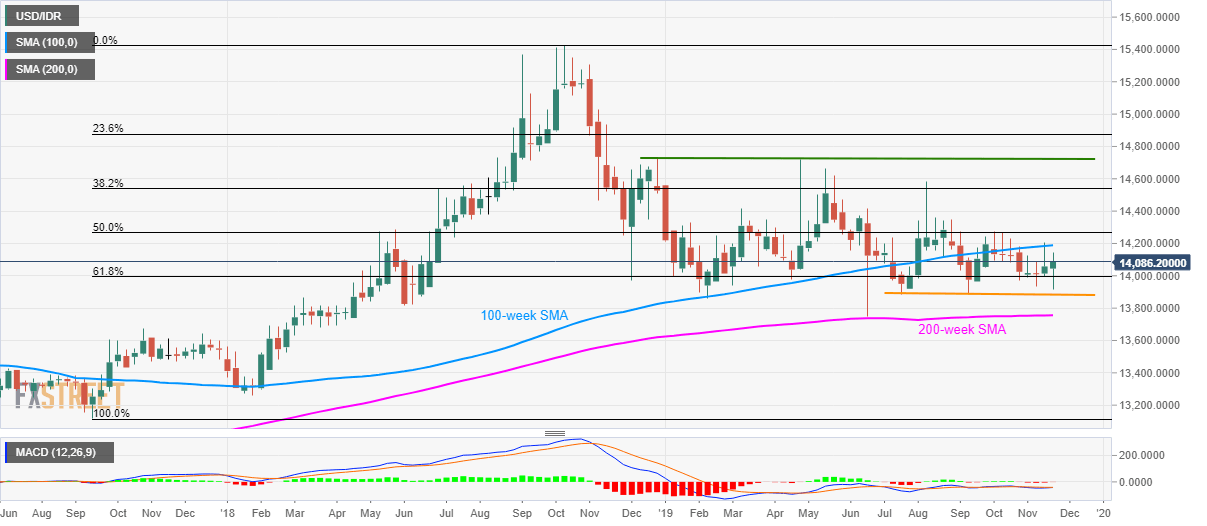
Despite repeated pullbacks from 61.8% Fibonacci retracement of September 2017 to October 2018 upside, USD/IDR stays below 100-week SMA while taking rounds to 14,090 during early Tuesday.
Not only the 100-week Simple Moving Average (SMA) level of 14,190, 50% Fibonacci retracement around 14,270 and 14,360/65 could also limit the pair’s upside ahead of fueling it to August month top close to 14,580.
Given the bull’s ability to cross August high, a horizontal area around 14,718/25, including highs marked in December 2018 and April 2019, will be in the spotlight.
Alternatively, pair’s sustained trading beyond 61.8% Fibonacci retracement level of 13,990 portrays the underlying momentum strength while July and September month lows near 13,880, close to 200-week SMA level of 13,750, could limit further declines.
USD/IDR daily chart
Trend: Sideways
