- USD/IDR trades near nine-day low after breaking 50-DMA.
- 38.2% Fibonacci retracement, 2.5-week-long rising trend-line limit immediate declines.
Even after extending the downside break of 50-day simple moving average (DMA), USD/IDR stays above near-term key supports as it takes the rounds to 14,122 during Asian session on Thursday.
38.2% Fibonacci retracement of April-June declines, near 14,115, and a rising trend-line since June 23, around 14,090, act as immediate supports for the pair traders to watch.
If sellers dominate past-14,090, 14,000 round-figure and 23.6% Fibonacci retracement near 13,970 could offer intermediate halts to the pair’s drop to July month low surrounding 13,880.
Meanwhile, pair’s sustained break above 50-DMA level of 14,143 enables it to confront a month-old falling trend-line, at 14,263 now, a break of which can propel prices to 61.8% Fibonacci retracement level around 14,350.
USD/IDR daily chart
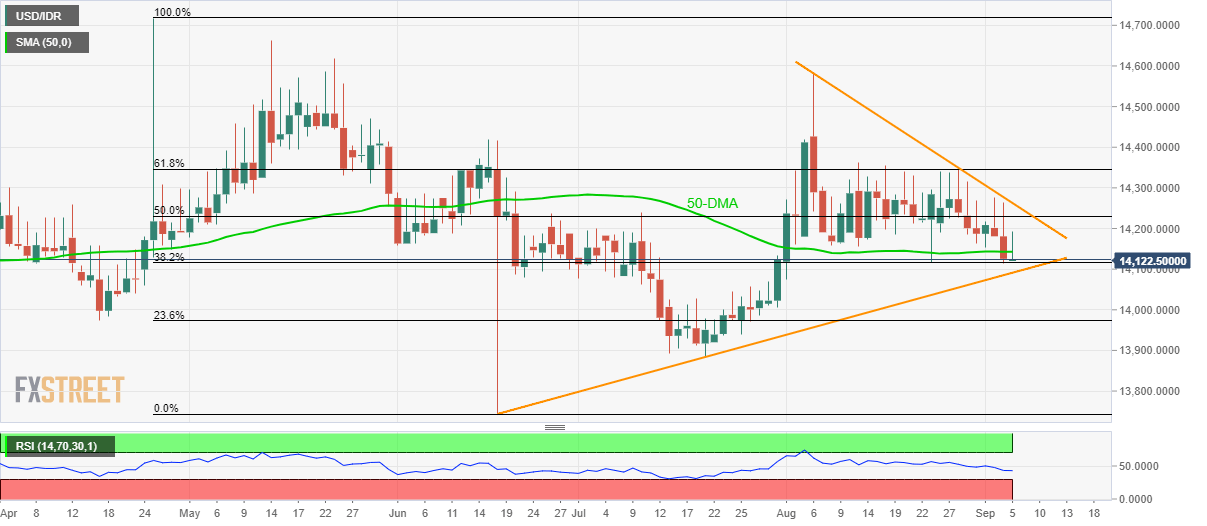
Trend: pullback expected
