- USD/IDR stays in a fortnight-old trading range while stepping back from 200-day EMA.
- Bearish MACD signal underlying weakness in momentum, 14,350/65 could please buyers during upside break.
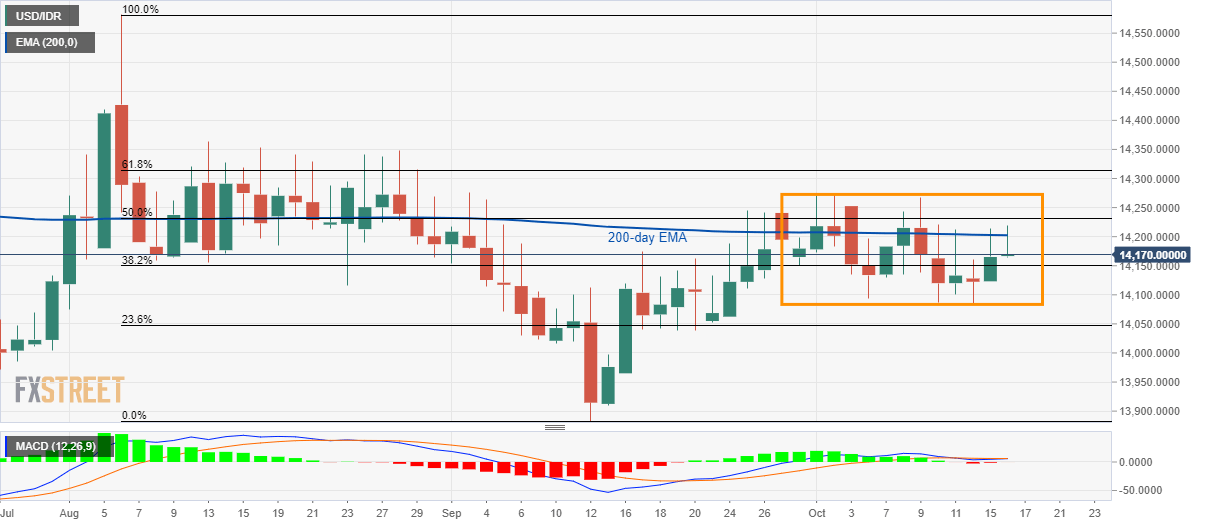
USD/IDR registers another pullback from 200-day Exponential Moving Average (EMA) while taking rounds to 14,170 during Wednesday’s Asian session.
Considering bearish signal from 12-bar Moving Average Convergence and Divergence (MACD), the pair is likely declining towards the lower end of the short-term trading range, near 14,085/80.
However, pair’s further downside might struggle around 14,040/35 and 14,000 rest-points, if not then the yearly low nearing 13,880 will lure bears.
Meanwhile, pair’s daily closing above 200-day EMA level of 14,202 can question range’s resistance, around 14,270/75, a break of which could trigger fresh run-up towards 14,350/65 area including highs marked since mid-August.
It should also be noted that the pair’s rise above 14,365 might not hesitate to push bulls in the direction to 14,420 and August month high surrounding 14,585.
USD/IDR daily chart
Trend: sideways
