- USD/IDR stays below near-term key resistances.
- 23.6% of Fibonacci retracement acts as immediate support.
- Mid-August tops gain bull’s attention on the successful breakout.
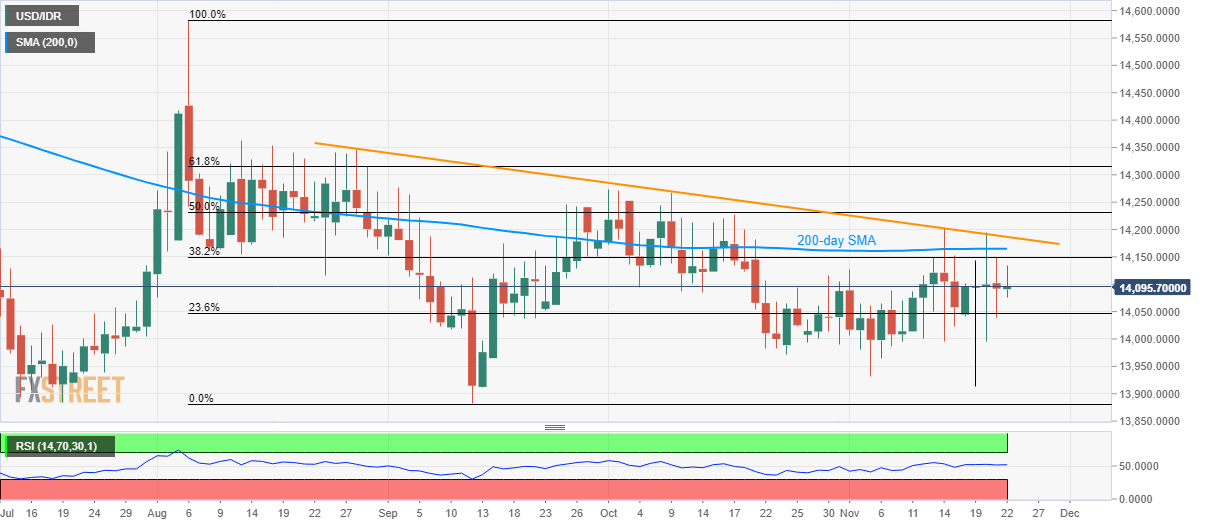
USD/IDR offers no major moves while trading below key resistances. The quote seesaws near 14,095 by the press time of early Friday.
Given the pair’s sustained trading below 200-day Simple Moving Average (SMA) level of 14,165 and a descending trend line since late-August, prices are likely to extend the downpour.
In doing so, 23.6% Fibonacci retracement level of August-September declines, at 14,045, can offer immediate support ahead of multiple lows near 13,975.
Though, lows marked in early-August and also in September also strong support around 13,880.
Meanwhile, pair’s sustained a break of 14,190, comprising the aforementioned resistance line, could trigger fresh rise towards 61.8% Fibonacci retracement level near 14,315 whereas mid-August tops close to 14,365 could challenge buyers then after.
Should there be further upside beyond 14,365, the 14,415 level can offer an intermediate halt during the rise to August month top of 14,583.
USD/IDR daily chart
Trend: Bearish
