- A successful break of 21-day SMA shifts market focus back to 200-day SMA.
- RSI also favors the upside.
Sustained break of 21-day SMA currently propels the USD/IDR pair towards 200-day SMA as it takes the rounds to 14,416 during early Tuesday.
The pair recently crosses 21-day simple moving average (SMA), which in-turn enable it to question the next important resistance i.e. 200-day SMA near 14,440. However, the latest high near 14,420 might offer an intermediate halt to the price rally.
In a case where the quote manages to clear 14,440 mark, May month high near 14,660 and a horizontal-line near 14, 720/25 could flash on buyers’ radar.
It should also be noted that 14-day relative strength index (RSI) is also not overbought yet and signal brighter chances of the pair’s rise over the important resistance.
Alternatively, the pair’s decline below 21-day SMA level of 14,327 highlights 23.6% Fibonacci retracement of October 2018 to February 2019 downturn near 14,230.
During additional downside past-14,230, 14,140, 14,050 and 14,000 may entertain sellers ahead of pleasing them with April low surrounding 13,970.
USD/IDR daily chart
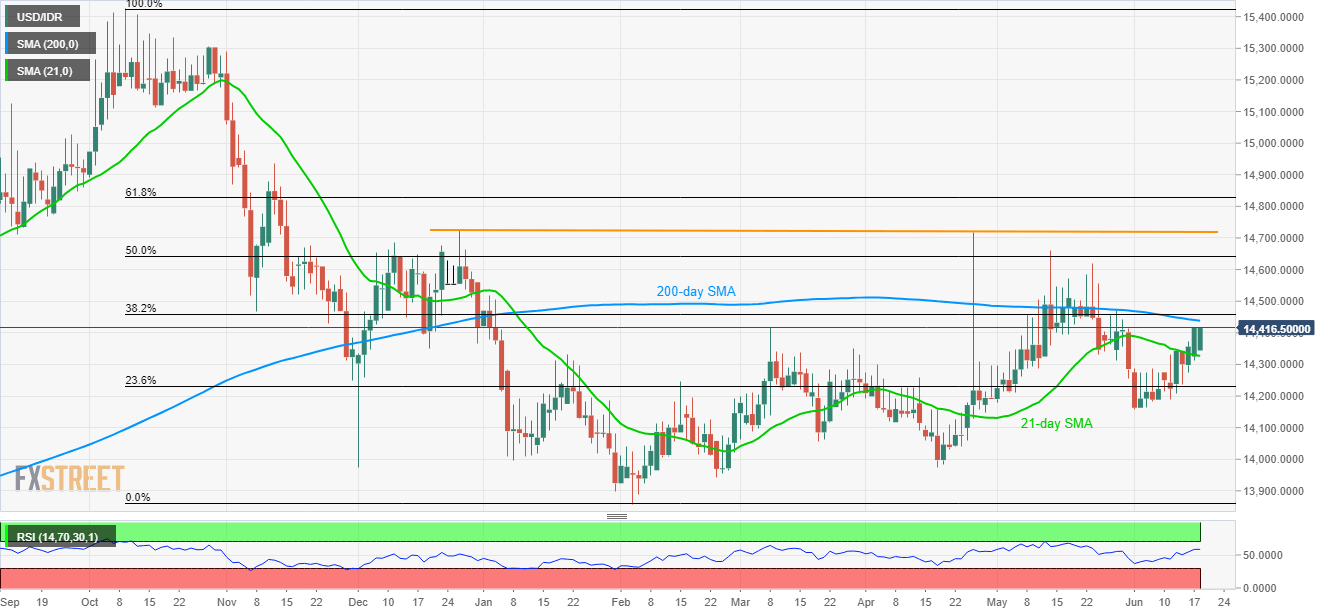
Trend: Bullish
