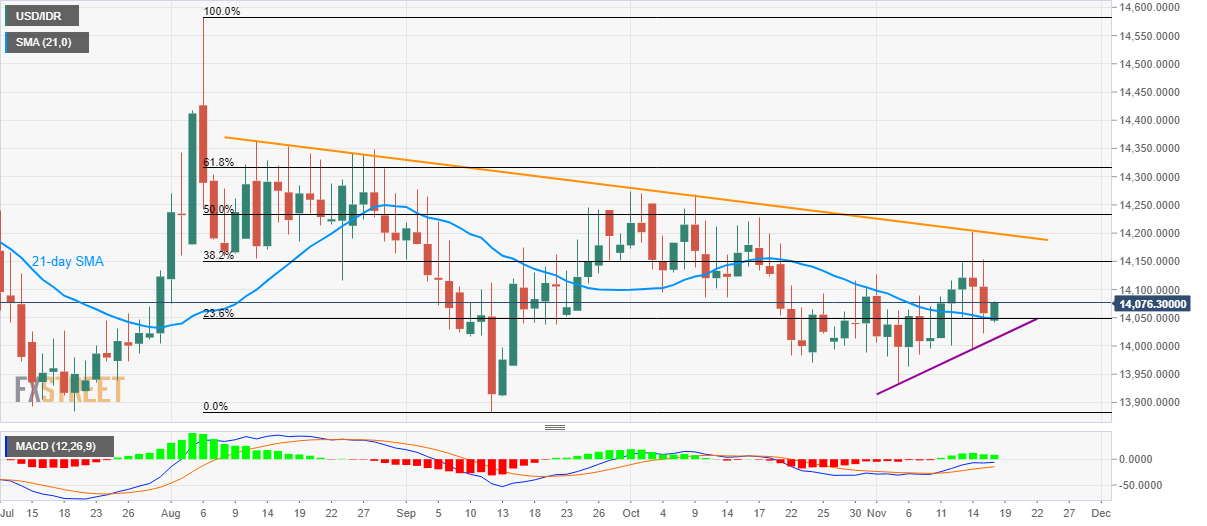
- USD/IDR bounced off 21-day EMA, 23.6% Fibonacci retracement.
- A nearly two-week-old rising trend line adds to the support.
- 38.2% Fibonacci retracement, a falling resistance line act as key upside barriers.
Given the USD/IDR pair’s recent pullback from short-term key support confluence, buyers cheer 14,076 as a quote amid early Monday trading in Asia.
Considering the pair’s recent recovery from 21-day Simple Moving Average (SMA) and 23.9% Fibonacci retracement of August-September declines, prices are likely rising towards 14,150 mark including 38.2% Fibonacci retracement.
However, a downward sloping trend line since late-August, at 14,200, could keep the pair’s further upside in check, if not then October month high near 14,275 will gain market attention.
On the downside break of 14,050/45 support confluence, an ascending support line since November 05, will restrict pair’s declines around 14,012 ahead of highlighting 14,000 round-figure to sellers.
In a case where bears dominate below 14,000, lows marked in July and September around 13,880 will be the key to watch.
USD/IDR daily chart
Trend: Recovery expected
