- USD/IDR fails to hold on to recovery gains amid bearish MACD.
- 23.6% Fibonacci retracement becomes nearby support to watch unless the pair trades below 14,143/50 resistance-zone.
USD/IDR falls short of extending Friday’s pullback as it trades near 14,130 during the early Asian session on Monday.
With the bearish signal from 12-bar Moving Average Convergence and Divergence (MACD), the pair is likely to decline further towards 14,048/38 support area including 23.6% Fibonacci retracement of August-September downpour and September 20 low.
During the pair’s further weakness below 14,038, 14,000 and September month low nearing 13,880 could lure sellers.
Meanwhile, pair’s successful break above 14,143/50 resistance-region comprising 38.2% Fibonacci retracement and 21-day Simple Moving Average (SMA) could trigger fresh run-up to 50% Fibonacci retracement level of 14,233 whereas a falling trend line since late-August, at 14,245, might challenge bulls afterward.
USD/IDR daily chart
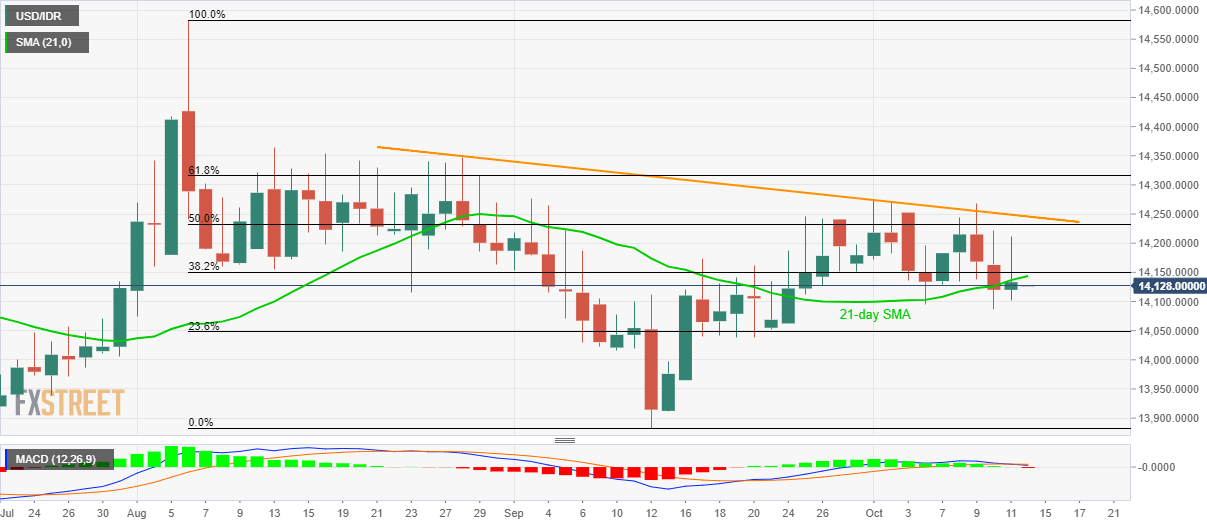
Trend: bearish
