- 21-DMA holds the gate to confront tough resistances on the north.
- Near-term rising trend-line restricts the downside.
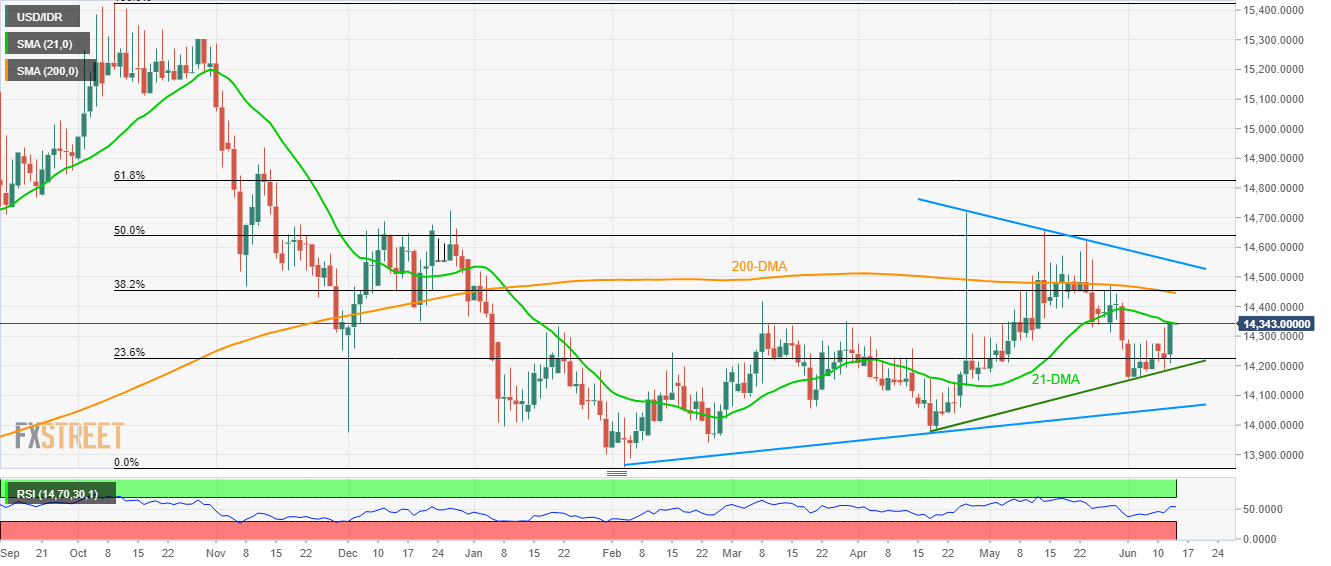
Despite registering a noticeable increase on Wednesday, the USD/IDR pair presently struggles around 21-DMA to extend its latest upside as it quotes 14,343 during early Thursday.
Should buyers manage to extend recent advances beyond 21-day simple moving average (21-DMA), 38.2% Fibonacci retracement of October 2018 to February 2019 downpour and 200-DMA together constitute a tough challenge to them near 14,445/55.
During the quote’s additional rise past-14,455, seven-week-old descending trend-line at 14,550 could play its role of resistance.
Meanwhile, 14,270 and short-term ascending trend-line surrounding 14,192 can entertain sellers in the case of the pullback.
Furthermore, March month bottom near 14,055 and 14,000 round-figure might come back on the chart once traders defy 14,157 support.
USD/IDR daily chart
Trend: Pullback expected
