- USD/IDR bounces off 14-day old support-line but fails to clear 4H 50MA.
- Short-term falling wedge limits the pair’s moves.
With the 50-bar moving average on the four-hour chart (4H 50MA) limiting the immediate upside of the USD/IDR pair, the quote declines to 14,060 amid initial Asian session on Thursday.
Considering the falling wedge pattern’s existence since August 23, prices are likely declining towards formation support of 14,000 while July 25 low near 13,940 and July 19 low close to 13,880 could please sellers next.
In a case prices rise beyond 4H 50MA level of 14,120, pattern resistance of 14,160 becomes the key as a sustained break of which could trigger fresh run-up towards 14,340/50 area including multiple highs marked during late-August.
In a case where prices keep rallying past-14,350, 23.6% Fibonacci retracement of July-August upside near 14,420 and August month top surrounding 14,580 will come back to the chart.
USD/IDR 4-hour chart
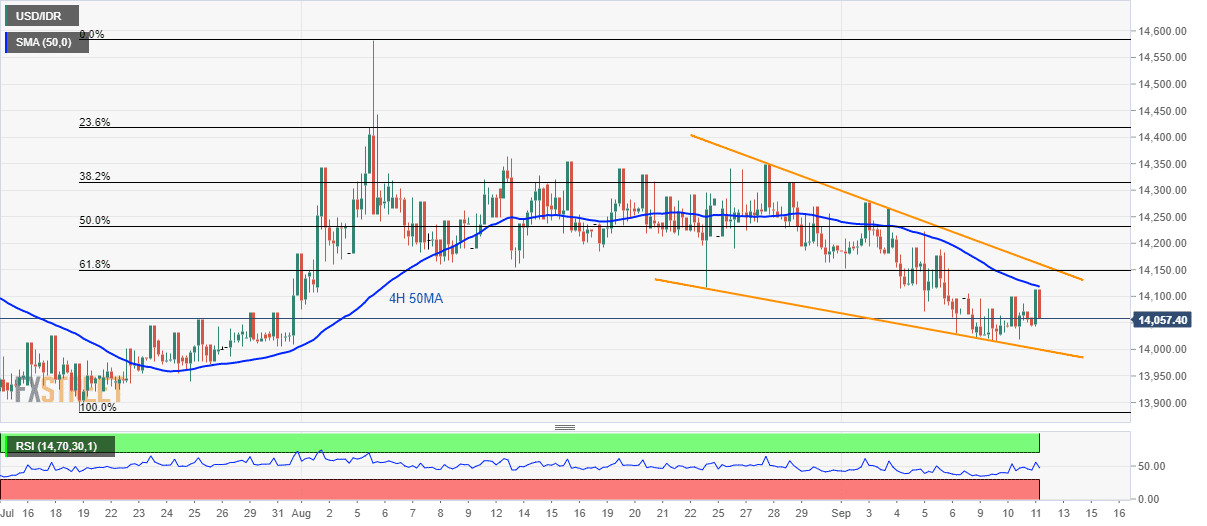
Trend: sideways
