- The USD/IDR pair’s bounce from 23.6% Fibonacci retracement has key immediate resistances to clear.
- February low can gain sellers’ attention during additional declines.
Having bounced off 23.6% Fibonacci retracement June month slump, USD/IDR trades near 14,012 during early Asian morning on Wednesday.
50% Fibonacci retracement level of 14,080 and 100-bar moving average on the 4-hour chart (4H 100MA), at 14,106, can question the pair’s additional recovery at the momentum.
Should prices rally past-14,106, a month old descending trend-line around 14,190 may please buyers.
On the downside break of 23.6% Fibonacci retracement level of 13,900, February month low close to 13,860 may entertain bears ahead of highlighting 13,750 on their radar.
USD/IDR 4-hour chart
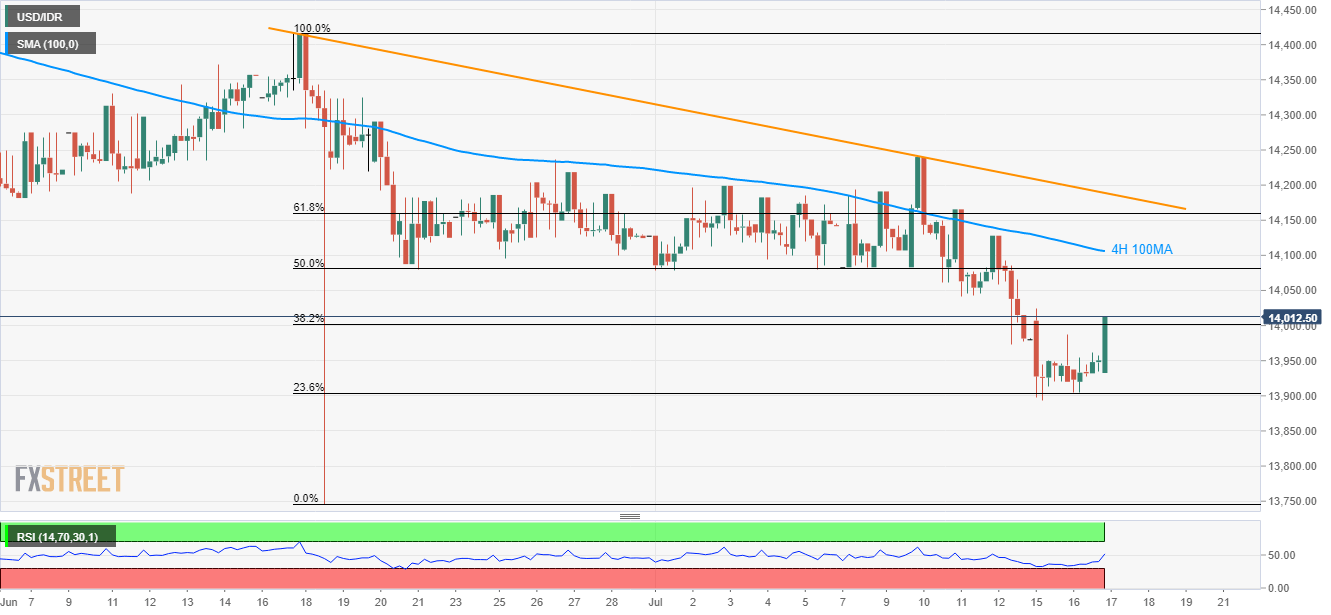
Trend: Pullback expected
