- USD/IDR portrays two-week-old rising wedge bearish formation on the four-hour chart.
- Sellers await a break of 14,100 to aim for further downside amid overbought RSI.
Despite marking gradual recoveries in the last two weeks, USD/IDR forms a bearish technical pattern on the chart as it trades near 14,150 during Asian session on Thursday.
With the overbought conditions of 14-bar relative strength index (RSI), sellers await a break of 14,100 in order to confirm a “rising wedge” pattern on the four-hour chart, which in -turn could quickly drag the pair to 14,000 and then to recent lows nearly 13,880.
On the contrary, pair’s run-up beyond 14,255 pattern resistance will defy the bears and can escalate the present recovery towards 61.8% Fibonacci retracement of August-September declines, at 14,315.
However, pair’s upside past-14,315 needs to cross the 14,350/60 multiple resistance area to target 14,420 and August month top close to 14,580.
USD/IDR 4-hour chart
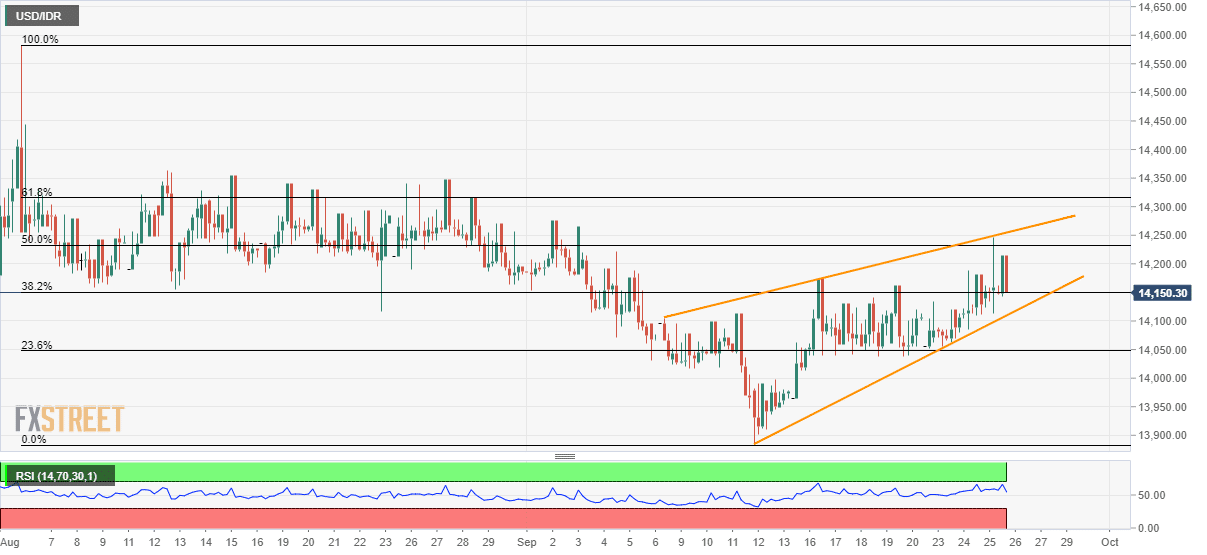
Trend: pullback expected
