- Sustained break of near-term trend-line and 100-day SMA portrays the pair’s strength.
- Indonesian inflation will be the key to watch for fresh impulse.
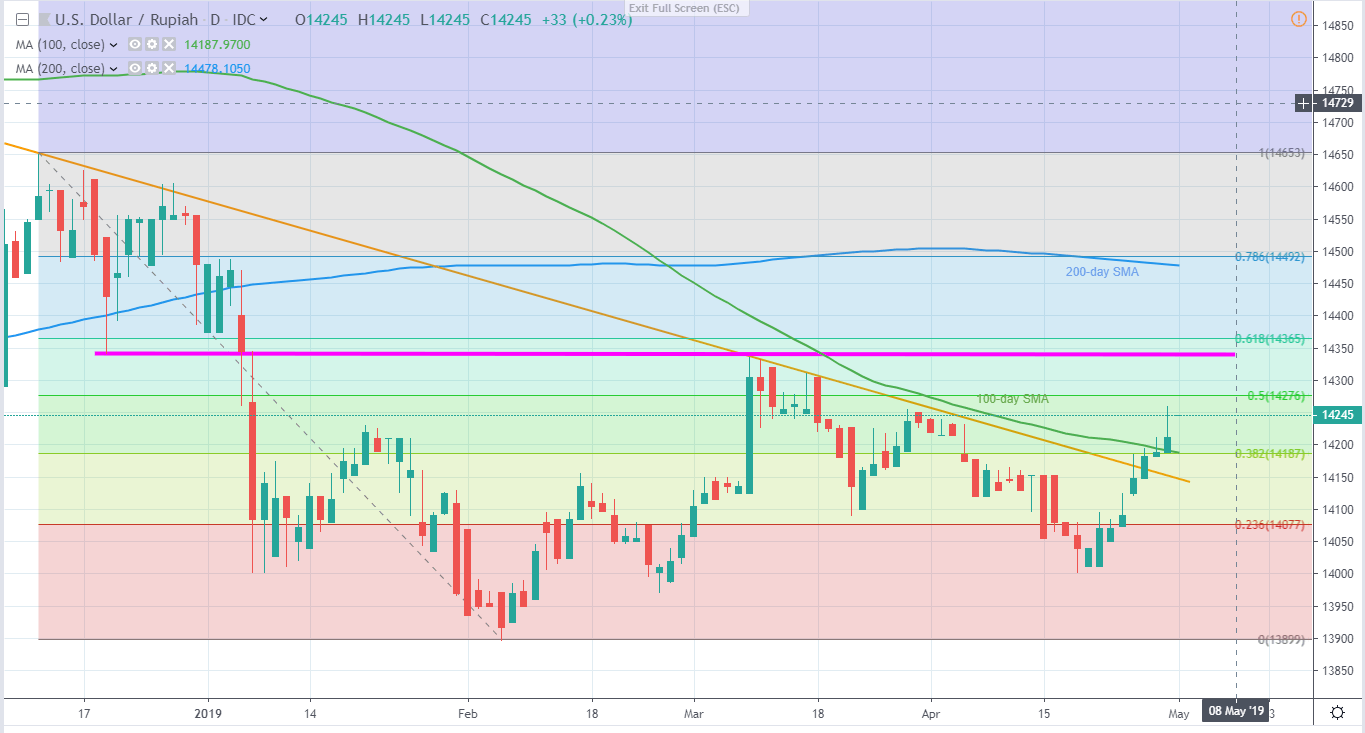
USD/IDR is taking the rounds near 14,245 during early Wednesday. The pair recently crossed 18-week old descending trend-line (TL) and is beyond 100-day simple moving average (SMA) by the press time.
While a successful break of important TL and SMA portrays the pair’s strength, traders might wait for April month inflation numbers from Indonesia that are up for release tomorrow. Forecasts suggest the headline inflation rate rise on a monthly and a YOY basis respectively from 0.11% and 2.48%.
50% Fibonacci retracement of December – February declines near 14,280 seems immediate upside resistance for buyers to tackle ahead of targeting 14,335/45 area that includes December 19 low and highs marked on January 07 and March 08.
During the quote’s additional rise past-14,345, 61.8% Fibonacci retracement near 14,370 and 14,440 may offer intermediate halts to its rally towards 200-day SMA level of 14,480.
On the downside break of 14,185 support, comprising 100-day SMA and 38.2% Fibonacci retracement, resistance-turned-support near 14,150 and 14,100 may gain market attention prior to 14,000 round-figure.
Also, February month lows near 13,800 may appear on bears’ list under 14,000.
USD/IDR daily chart
Trend: Positive
