- A fortnight old upward sloping trend-channel portrays the momentum strength.
- Overbought RSI and repeated failure to cross important resistance-area favors pullback.
Despite registering another failure to clear 14,335/45 resistance-area, USD/IDR is still positive while trading near 14,300 during early Wednesday.
Not only an area comprising December 19 low and highs since January 2019 but overbought conditions of 14-day relative strength index (RSI) also challenges buyers around 14,335/45.
As a result, support-line of an immediate ascending trend-channel at 14,270 gains market attention.
Should prices slip beneath the channel formation, 100-day simple moving average (SMA) level near 14,175 and 14,150 could come back on the chart ahead of pushing sellers towards 14,100 and 14,000 round-figure rest-points.
If at all bulls manage to conquer 14,345 upside barrier, upper-line of the aforementioned channel at 14,390 now, can act as follow-on resistance to watch.
In a case where the upside continues past-14,390, optimists may wait for 14,400 cross to validate the sentiment in order to aim for 200-day SMA level of 14,475.
USD/IDR daily chart
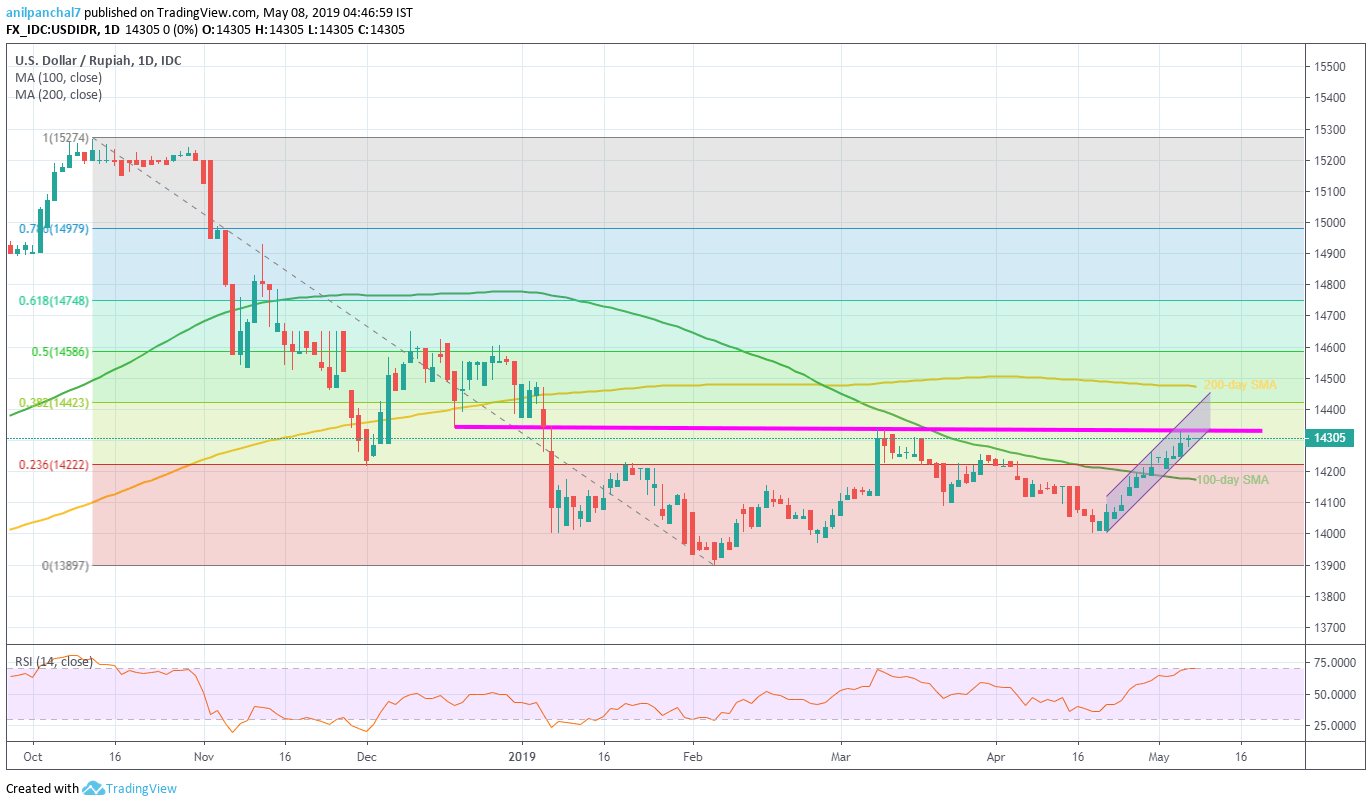
Trend: Pullback expected
