- 200-week MA, 61.8% Fibonacci retracement of previous-year move limit USD/IDR declines.
- Buyers can aim for 50% Fibonacci retracement on the break of 14,255/60.
Despite failures to sustain its bounce off 200-week moving average (MA), the USD/IDR pair refrains from declining below 61.8% Fibonacci retracement of its 2018 upside as it takes the bids to 14,191 on early Tuesday morning in Asia.
As a result, 14,255/60 area comprising mid-June lows can lure buyers whereas 50% Fibonacci retracement level of 14,343 may please them afterward.
Alternatively, a downside break of 14,087, including 61.8% Fibonacci retracement, sellers can aim for 13,974 and the yearly low around 13,858 ahead of targeting 200-week MA level of 13,736 during further declines.
It should also be noted that 14-bar relative strength index (RSI) seesaws in the normal region and indicates no shift in momentum.
USD/IDR weekly chart
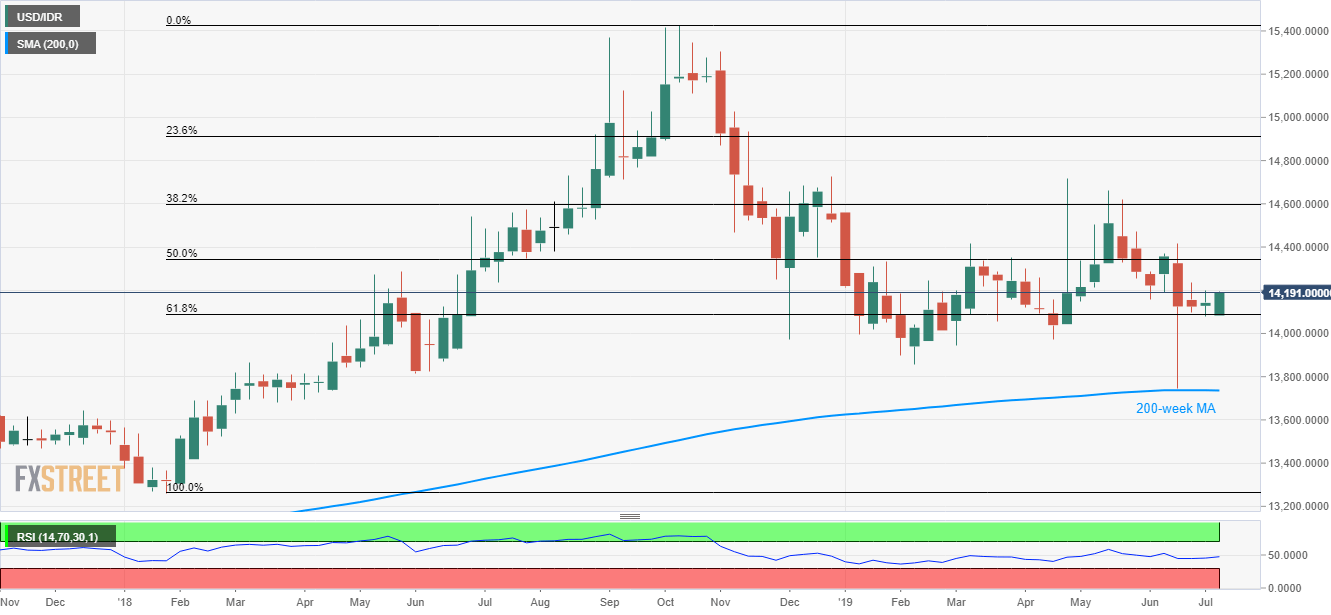
Trend: Bullish
