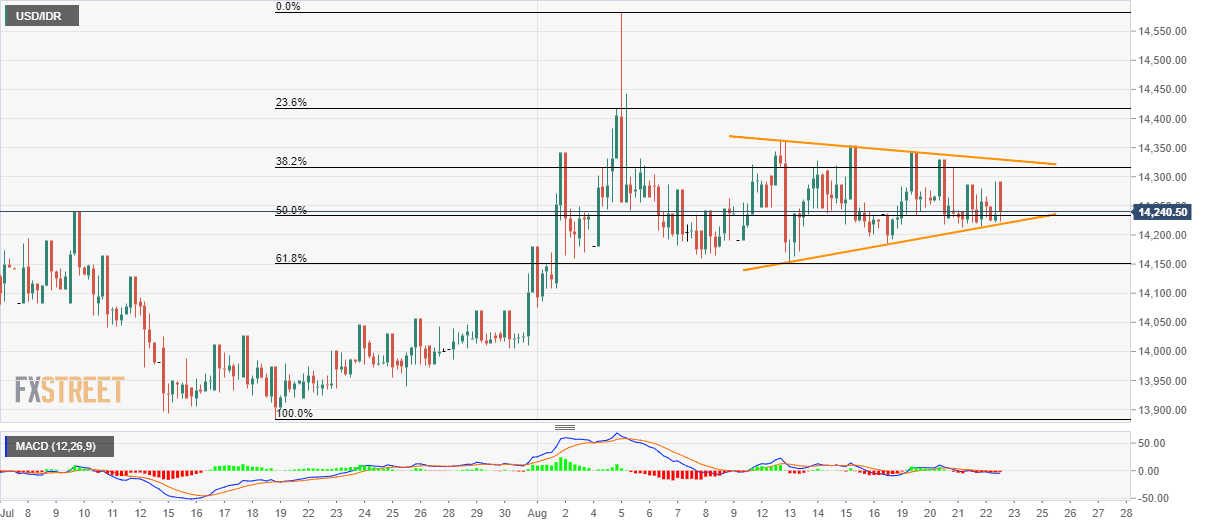
- USD/IDR keeps following a short-term symmetrical triangle formation since August 13.
- 61.8% Fibonacci retracement add to the support while 14,420 offers extra resistance.
USD/IDR shows little reaction to the previous day’s rate cut by the Bank Indonesia (BI) as it maintains immediate symmetrical triangle formation while taking rounds to 14,240 on early Friday.
The BI announced its second 2019 rate cut worth of 0.25% on Thursday. Though, markets shrug-off the news as major attention remains on the Jackson Hole Symposium.
The pair follow eight-day-old symmetrical triangle as far as it trades between 14,330 and 14,218, which in turn highlights the requirement of a break above/below the mentioned levels in order to witness trade momentum.
On the upside break of 14,330, 23.6% Fibonacci retracement of July-August run-up, around 14,420, holds the gate for the pair’s rally towards the monthly top of 14,583.
Alternatively, 61.8% Fibonacci retracement level of 14,150 and 14,000 could please sellers past-14,218.
USD/IDR 4-hour chart
Trend: Sideways
