USD/IDR closed at 14,182 on Friday, confirming a falling channel breakout on the daily chart.
While the bearish-to-bullish trend change is confirmed, the widely-tracked 100-day moving average (MA) resistance is still intact. At press time, that longer duration average is seen at 14,195 and the spot is trading at 14,180.
Daily chart
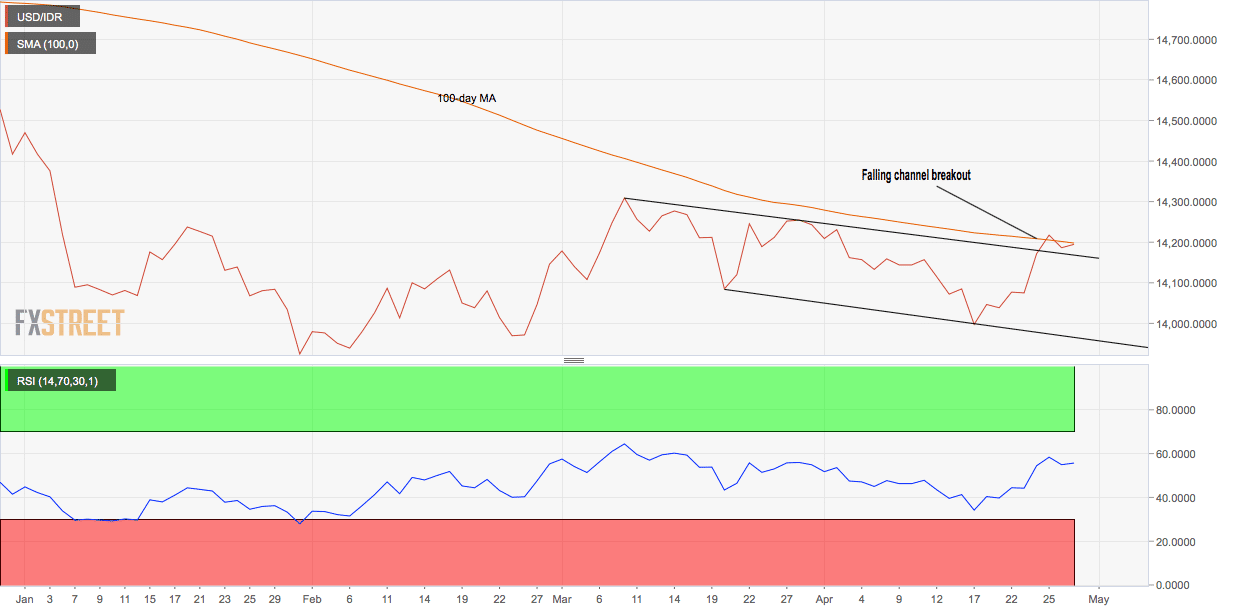
- As seen above, the 14-day relative strength index (RSI) is now printing bullish conditions with an above-50 print.
- The 5- and 10-day moving averages (MAs) are trending north, indicating a bullish setup.
As a result, the pair could soon find acceptance above the 200-day MA at 14,195. That would only validate the falling channel breakout confirmed on Friday and open up upside toward 14,335 (March 8 high).
Trend: Bullish above 200-day MA
