Despite recovering past-Indonesian election, the USD/IDR pair still has multiple upside resistances to clear to justify its strength while it trades near 14,120 during early Wednesday.
The first resistance being 14,1485/90 confluence including 38.2% Fibonacci retracement of December 2018 to February 2019 downturn and a four-week long descending trend-line.
Should prices manage to cross 14,190, 100-day simple moving average (SMA) near 14,210 and a downward sloping trend-line since early-March at 14,265 might lure the buyers.
Additionally, the pair’s successful rise above 14,265 highlights 14,330/40 resistance-area for the Bulls to observe.
Meanwhile, 23.6% Fibonacci retracement level near 14,060 and 14,000 could act as immediate support for the pair, a break of which can recall early-month lows near 13,970.
During the quote’s extended south-run beneath 13,970, 13,940, 13,870 and 13,855 are likely to become bears’ favorites.
USD/IDR daily chart
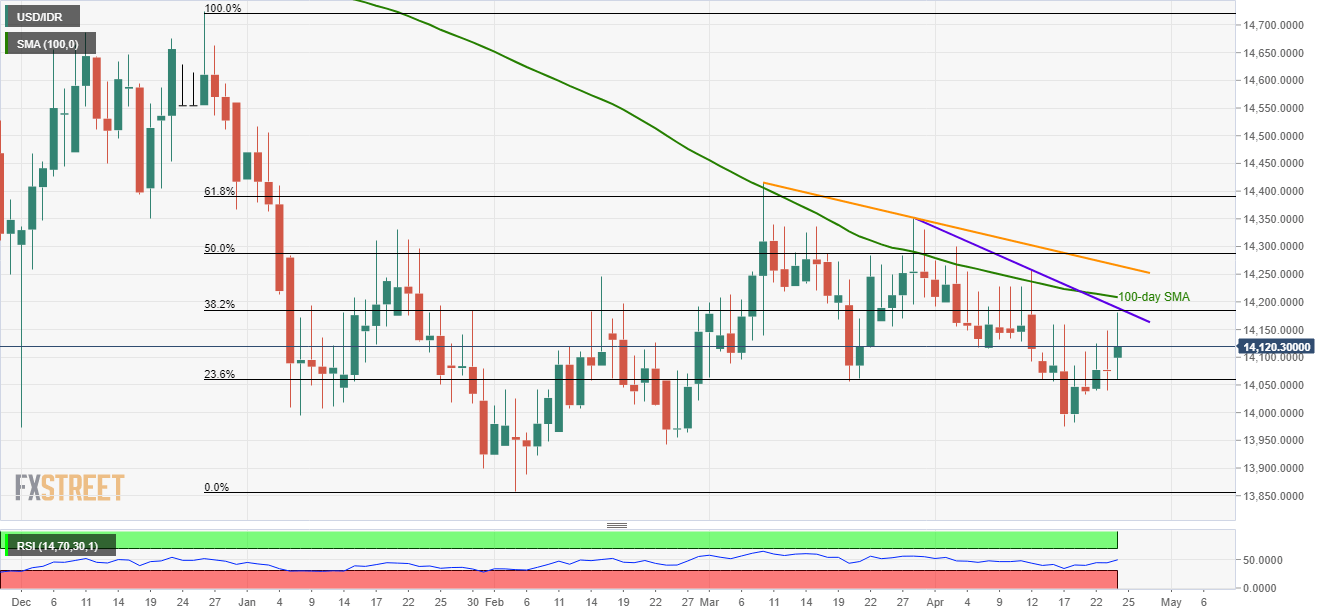
Trend: Pullback expected
