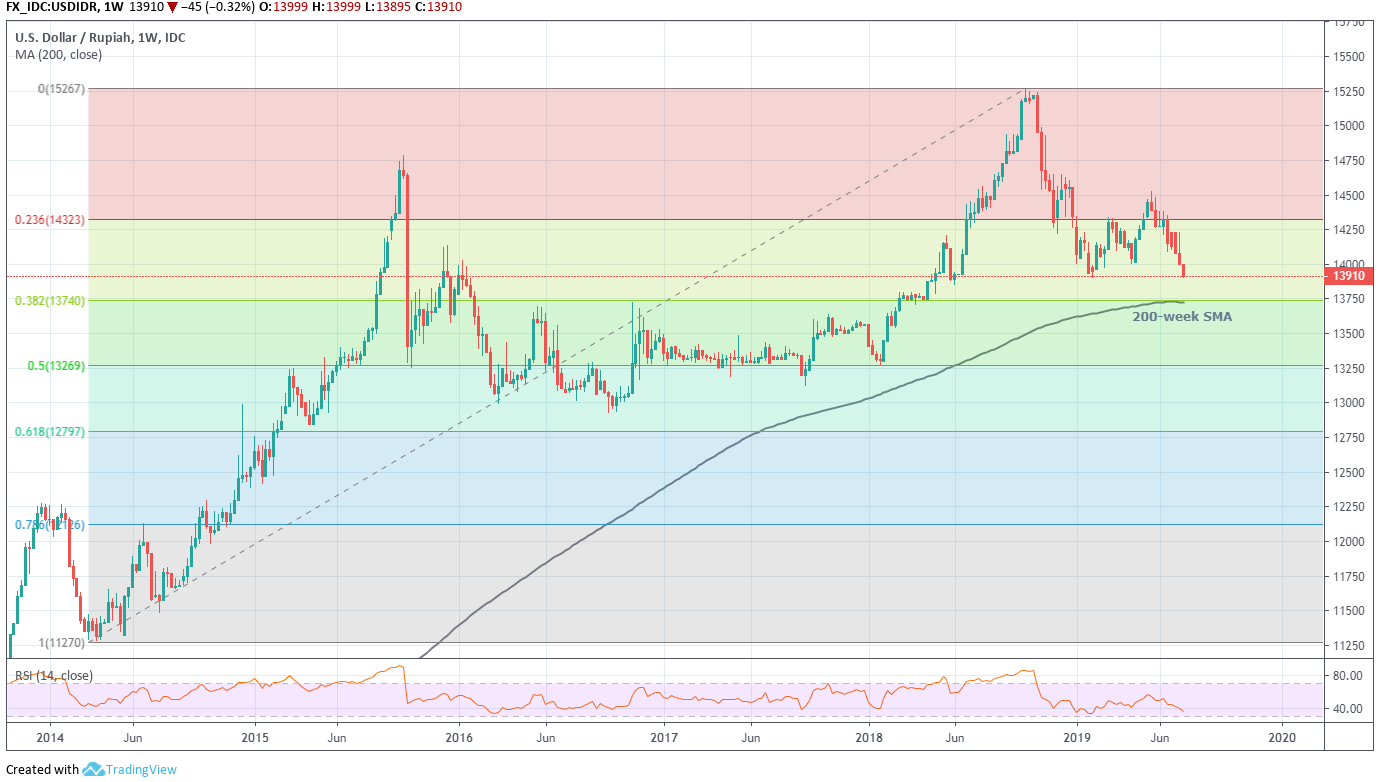
- Failure to extend pullbacks from 13,895 highlights the USD/IDR pair’s weakness.
- A 200-week simple moving average (SMA) and 38.2% Fibonacci retracement offer strong downside support.
Having repeated failure to rise much beyond February lows, USD/IDR declines to 13,905 ahead of the Europe markets open on Friday.
While 13,895 acts as adjacent support, a break of which can drag the quote to 13,740/25 support confluence including 38.2% Fibonacci retracement level of 2014 swing lows to 2018 swing highs and 200-week SMA.
On the upside, mid-June low around 14,085 and 23.6% Fibonacci retracement near 14,323 could be on the buyers’ radar during the pair’s U-turn.
It should also be noted that 14-bar relative strength index (RSI) is near to oversold conditions, increasing the odds for the pair’s pullback from key support.
USD/IDR weekly chart
Trend: Bearish

