- Overbought RSI and failure to successfully cross 200-day SMA question buyers.
- Sellers can sneak in if breaking short-term support-line.
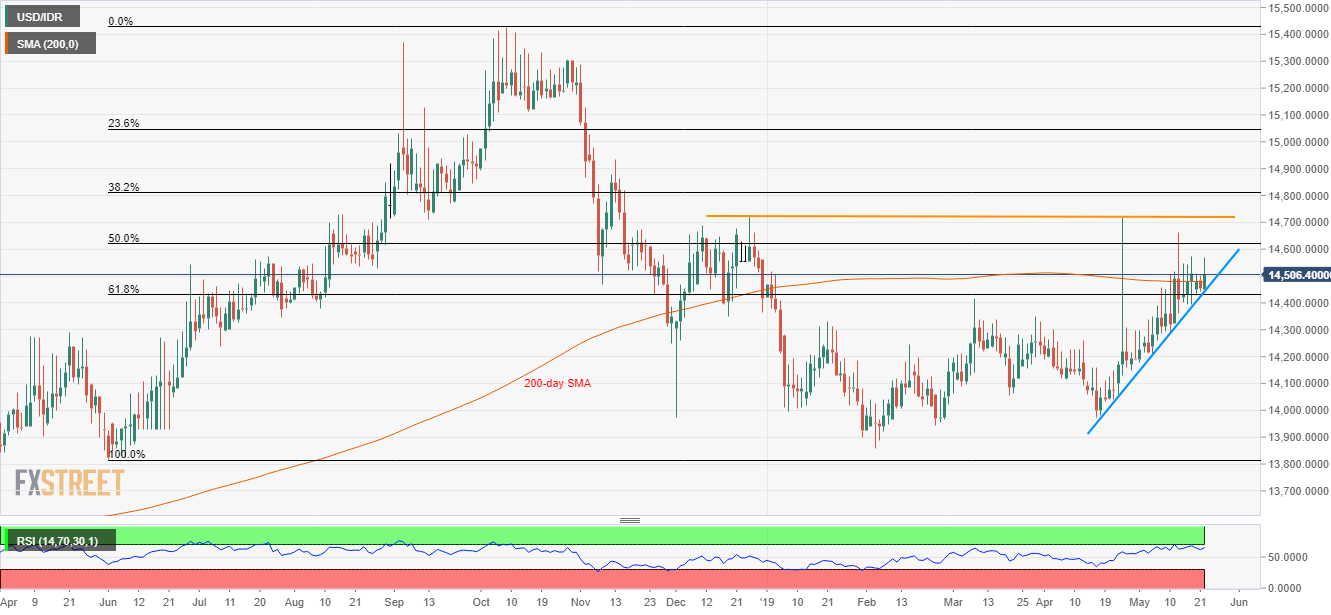
With the five-week-old ascending support-line continues to limit the USD/IDR pair’s immediate declines, the quote trades around 14,500 by the press time of early Wednesday.
However, overbought levels of 14-day relative strength index (RSI) and failure to provide a sustained rise beyond 200-day simple moving average (SMA) portrays the momentum weakness.
Hence, sellers can slip in if prices drop beneath 14,440 support-line but need to validate the downturn by conquering 61.8% Fibonacci retracement of June to October 2018 upside and March 2019 high surrounding 14,430/10.
If that happens, 14,300, 14,180 and 14,100 can quickly appear on the chart whereas 14,000 and April low near 13,980 can lure bears afterward.
Should there be a successful rise above 200-day SMA level of 14,480, 50% Fibonacci retracement level near 14,630 and a horizontal line connecting December 2018 top to April 2019 high at 14,720 may become buyers’ favorites.
Additionally, pair’s sustain trading past-14,720 may challenge 14,870 and 14,940 ahead of aiming 15,000 round-figure.
USD/IDR daily chart
Trend: Pullback expected
