- 100-DMA limits USD/IDR upside off-late while a 20-week old ascending trend-line confines the quote’s declines.
- 23.6% Fibonacci retracement of current year movement adds support to the downside.
Having registered another failure to cross 100-day moving average (100-DMA), USD/IDR drops back to 14,125 during early Wednesday in Asia.
An upward sloping trend-line since February start near 14,090 grabs the market attention for now, a break of which could open the door for the pair’s extended downpour to 23.6% Fibonacci retracement level of 13,976.
Should prices keep declining past-13,976, February month low near 13,860 becomes sellers’ favorite.
Meanwhile, pair’s ability to cross the 100-DMA level of 14,209 still needs to successfully trade beyond 50% Fibonacci retracement of 14,236 in order to justify strength to target 61.8% Fibonacci retracement level of 14,351.
In a case, buyers refrain from respecting 14,351 resistance, 200-DMA level of 14,416 will regain market attention.
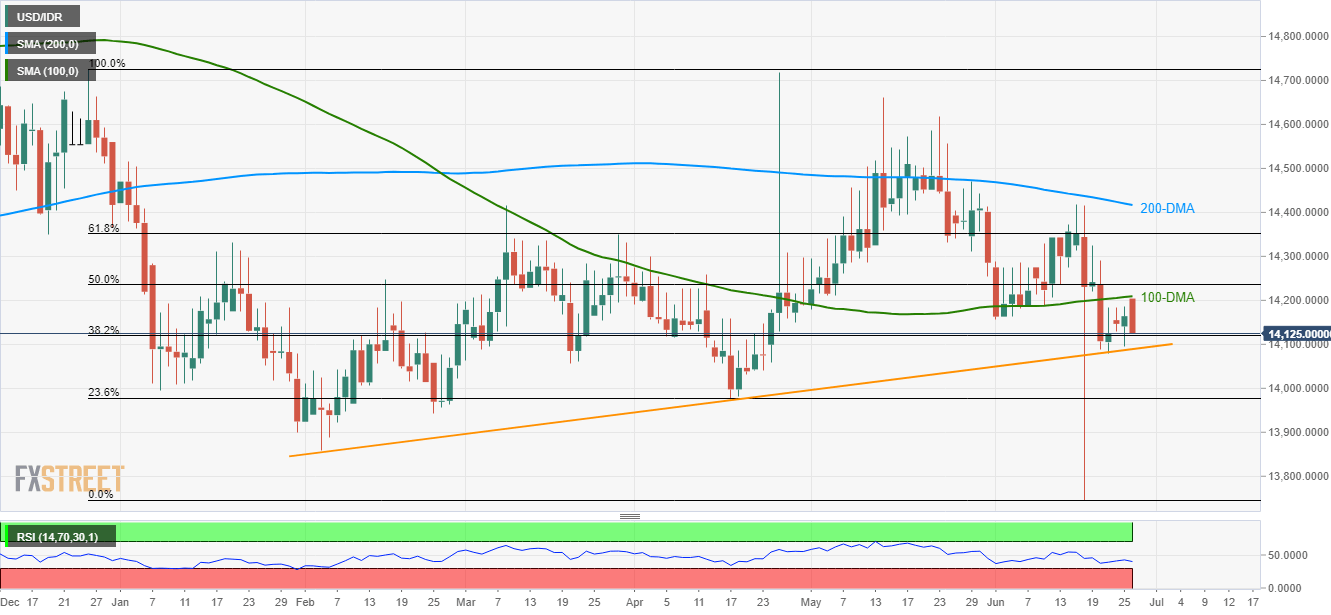
USD/IDR daily chart
Trend: Bearish
