- 61.8% Fibonacci retracement, 3-month resistance-line limit USD/IDR upside.
- 200-day EMA, 50% Fibonacci retracement together forms the key support.
Failure to cross 61.8% Fibonacci retracement of May-June downpour presently drags the USD/IDR pair towards key support-confluence as it trades near 14,247 during Friday morning in Asia.
The 50% Fibonacci Retracement and 200-day exponential moving average (EMA) portrays 14,230/29 support for sellers to watch during further declines, a break of which can recall June-start low near 14,157 and multiple lows marked during early July month surrounding 14,080.
On the upside, pair’s ability to cross 61.8% Fibonacci retracement level of 14,344 needs to cross 14-week-long resistance-line, at 14,385 now, in order to justify its strength to question June month top of 14,418.
Traders should also watch over 14-day relative strength index (RSI) that’s currently near the overbought territory and favors the latest pullback.
USD/IDR daily chart
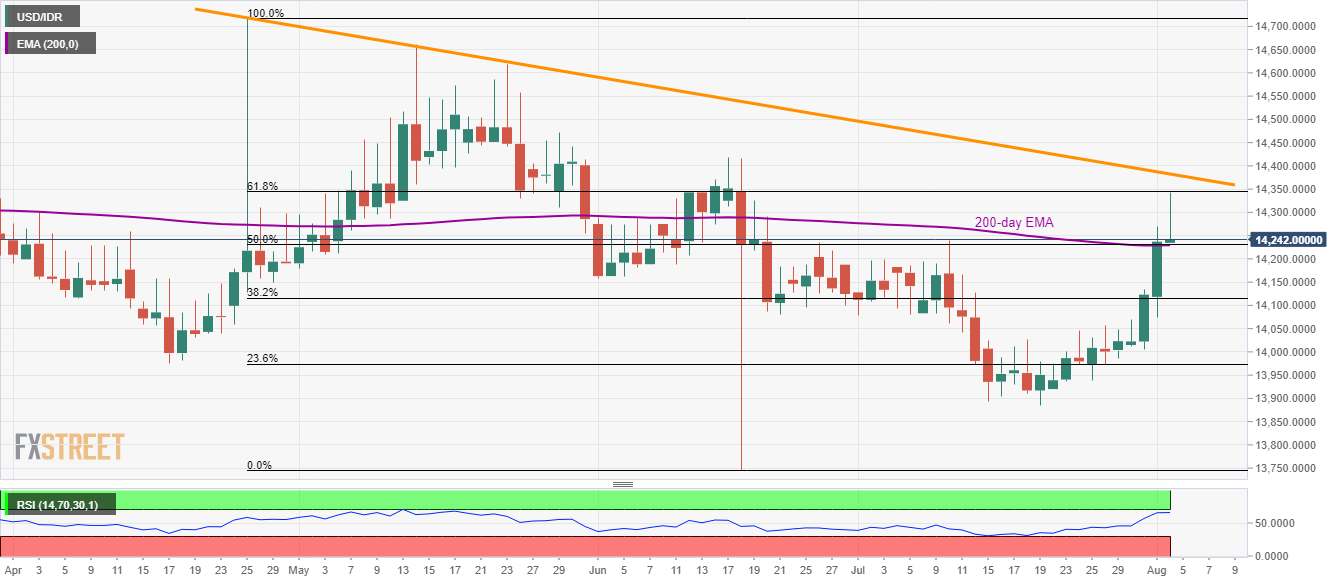
Trend: Pullback expected
