- U-turn from short-term key EMA, multiple resistances portray USD/IDR weakness.
- Nearly oversold RSI conditions challenge the pullback.
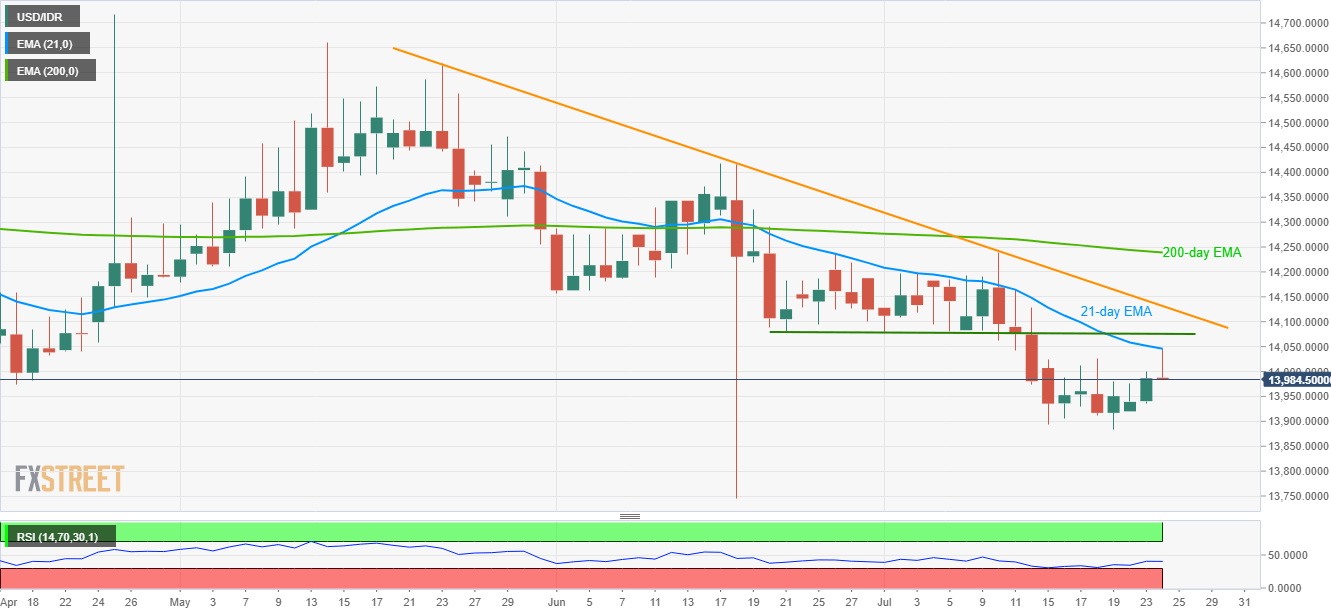
Even after rising to 8-day high, USD/IDR couldn’t clear 21-day exponential moving average (EMA), resulting in a pullback towards 13,985 by the press time of early Wednesday.
Given the recent decline, Monday’s high around 13,975 and the previous week’s bottom close to 13,885 gain market attention.
However, an upside clearance of 21-day EMA level of 14,045 can trigger the pair’s rise towards 14,078/80 horizontal-line comprising lows marked during late-June and early month.
Adding to the resistance will be a 2-month old descending trend-line near 14,132 that holds the key for the quote’s run-up to 200-day EMA around $14,240.
It should also be noted that 14-day relative strength index (RSI) is on the back foot and close to oversold conditions, which in turn brightens chances of the pair’s recovery.
USD/IDR daily chart
Trend: Pullback expected
