- An immediate bearish formation limits USD/IDR moves below key resistances.
- While a downside break of 13,954 can lure sellers, bulls wait for an upside clearance of 14,109 for fresh impulse.
8-day long rising wedge continues to limit the USD/IDR pair’s near-term moves as it makes the rounds to 14,000 during early Monday morning in Asia.
While 14,060 and 13,954 currently mark the bearish pattern’s extremes, a downside break of the support-line can trigger the quote’s fresh downpour targeting monthly low around 13,884 and February month low near 13,858.
Meanwhile, 200-bar moving average (4H 200MA) and a 6-week old descending trend-line could keep exerting downside pressure on prices around 14,100 and 14,110.
In a case where the quote rallies beyond 14,110, early-month top surrounding 14,240 could be on the buyers’ radar.
USD/IDR 4-hour chart
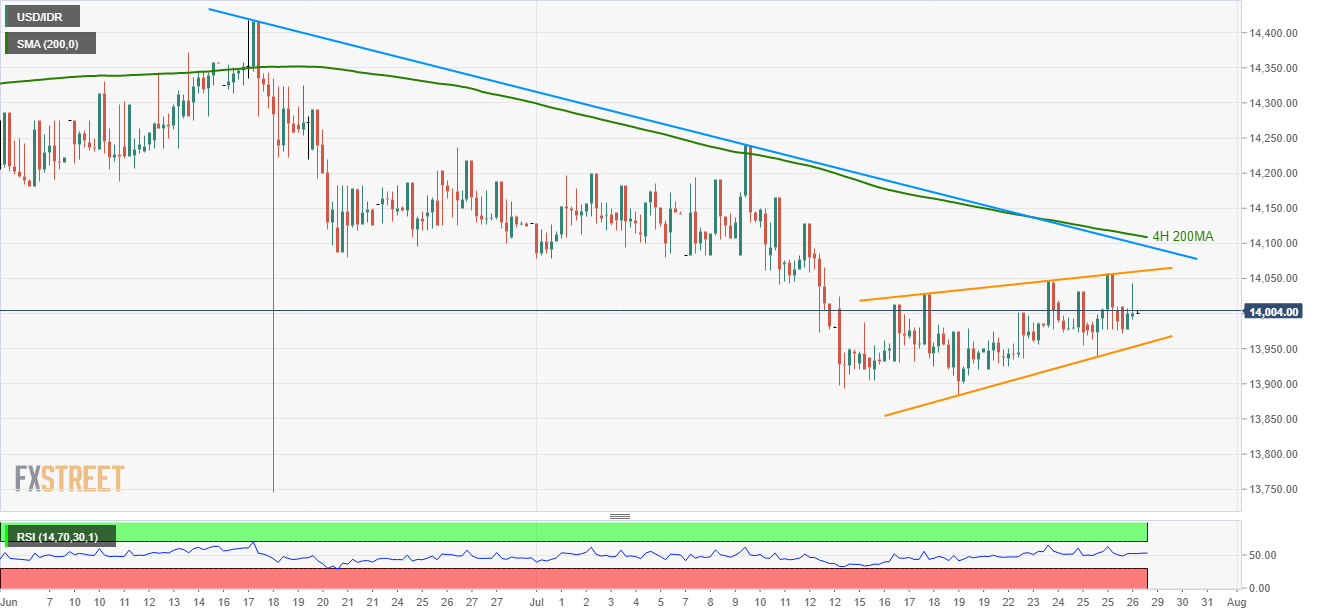
Trend: Bearish
