- USD/IDR trails a week-long descending trend-line.
- 14,160/50 and 200-DMA become crucial downside supports.
USD/IDR takes another turn from a six-day-old resistance-line as it declines to 14,260 during Wednesday’s Asian session.
The quote can take a halt near 50% Fibonacci retracement of July-August upside, at 14,233, ahead of visiting the key 14,160/50 support-zone including 13-day long horizontal-line and 61.8% Fibonacci retracement.
In a case prices slip below 14,150, 200-day simple moving average (DMA) at 14,118 can question sellers targeting 14,000 round-figure.
Meanwhile, pair’s successful run-up beyond 14,340 resistance-line can trigger fresh rally towards 23.6% Fibonacci retracement level of 14,418 whereas 14,443 and 14,583 could entertain buyers afterward.
USD/IDR 4-hour chart
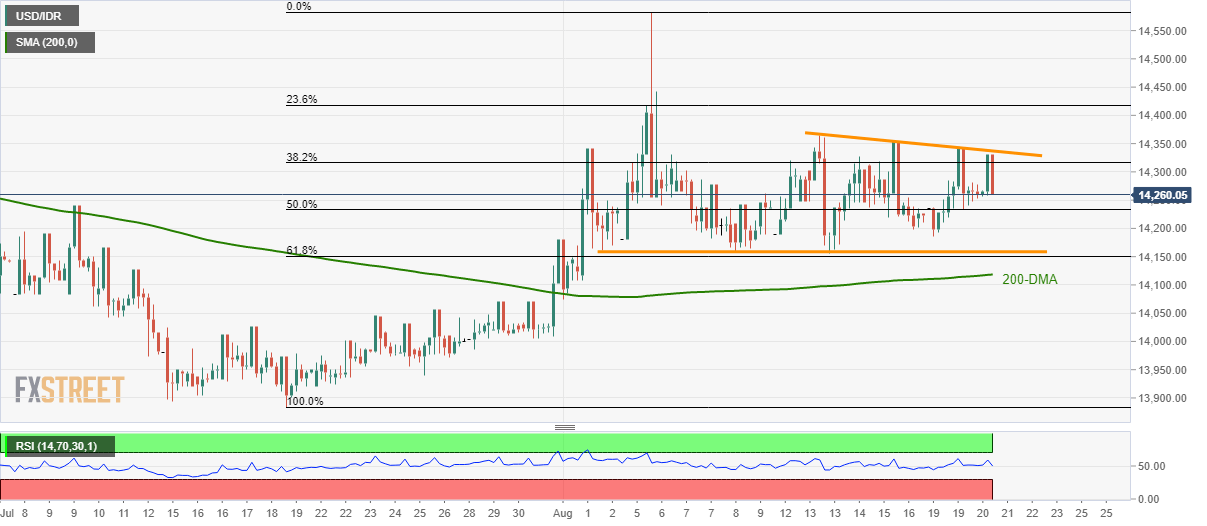
Trend: Pullback expected
