- Failure to cross 200-day SMA continues to portray the pair’s weakness.
- A month-long support-line becomes immediate support to watch.
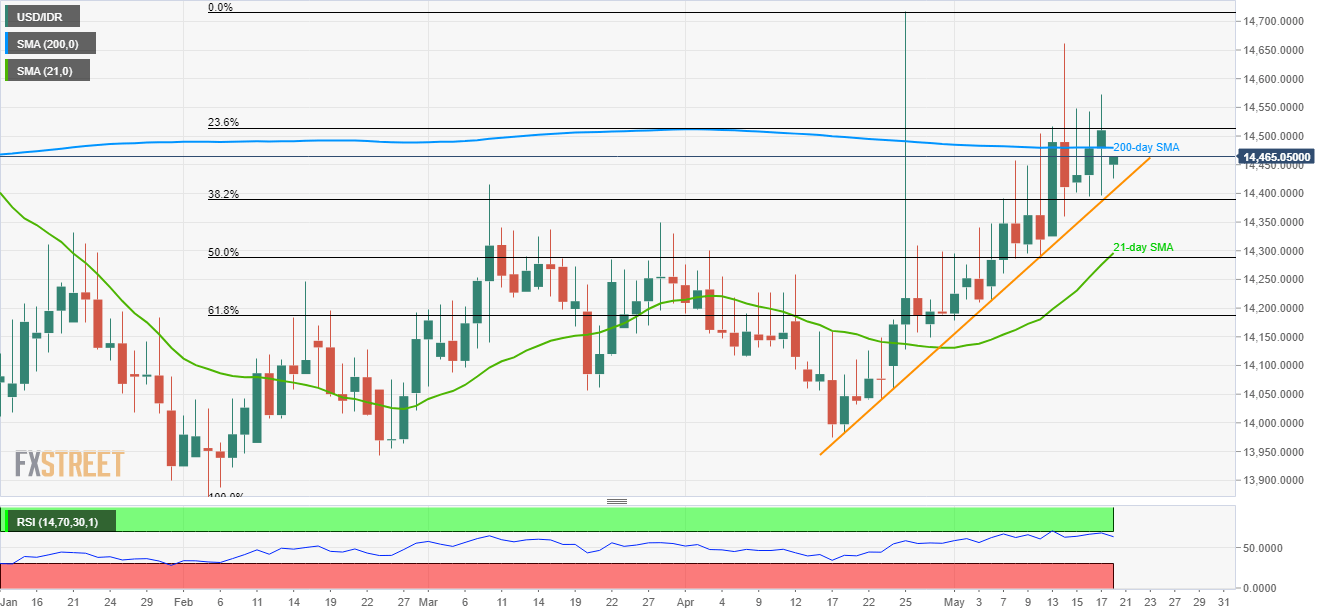
Following a failure to sustain 200-day SMA, the USD/IDR pair slipped beneath the same to test 14,445 during the initial Asian session on Monday.
The pair now aims to revisit an ascending support-line stretched since April 18, near 14,400 now, a break of which should recall March 28 high of 14,350 on the chart.
During the quote’s additional south-run under 14,350, 21-day simple moving average (SMA) level of 14,295, 14,230 and 61.8% Fibonacci retracement of its February to April upside, at 14,185, can gain sellers’ attention.
On the upside, 200-day SMA level of 14,480 continues to become important resistance that can escalate pair’s recovery 14,575.
In a case where prices keep rallying past-14,575, 14,665 and 14,720 could lure buyers.
USD/IDR daily chart
Trend: Pullback expected
