- USD/IDR fails to hold onto recovery gains.
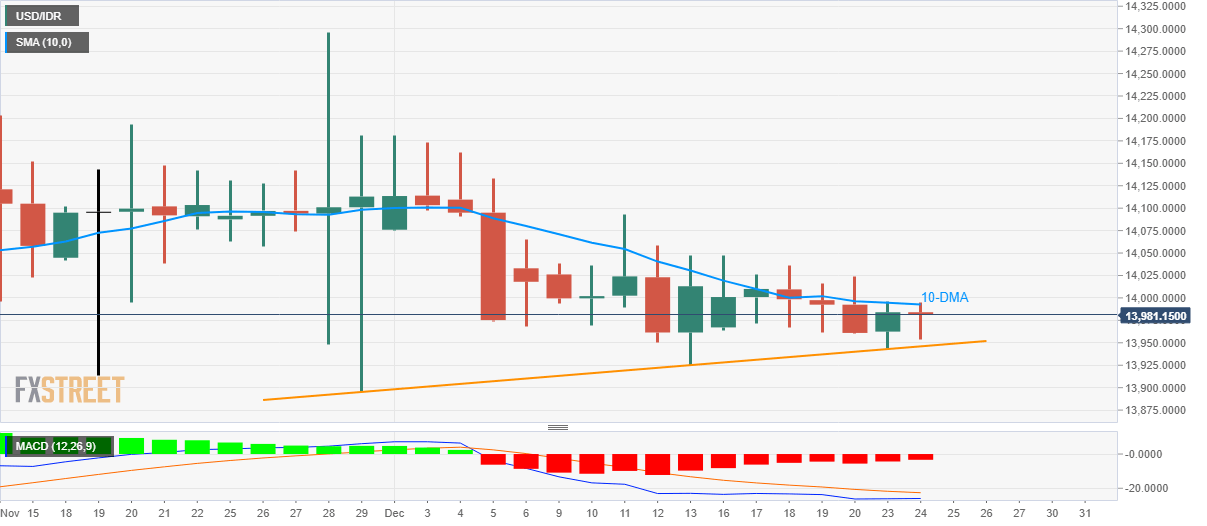
- 10-DMA exerts immediate downside pressure.
- The monthly trend line, lows marked in September and July act as the key support.
Failure to cross 10-Day Simple Moving Average (DMA) on a daily closing basis keeps the USD/IDR under pressure around 13,981 amid early Tuesday.
The pair has been trading beneath the key short-term DMA since the initial days of December. Also supporting the sellers are bearish signals from the 12-bar Moving Average Convergence and Divergence (MACD) indicator.
Even so, an upward sloping trend line since late-November, at 13,946 now, offers immediate support, a break of which could drag prices to lows marked in July and September months near 13,880.
On the upside, a clear break of 10-DMA level of 13,993 can trigger the pair’s fresh rise to December 11 high around 14,093. Though, the monthly top near 14,198 will cap the quote’s additional rise.
USD/IDR daily chart
Trend: Bearish
