- USD/IDR extends losses for the fifth week in a raw.
- 61.8% Fibonacci retracement of the 2017/18 rise has been activating the pair’s U-turn during the year.
- A seven-month-old falling trend line restricts short-term upside.
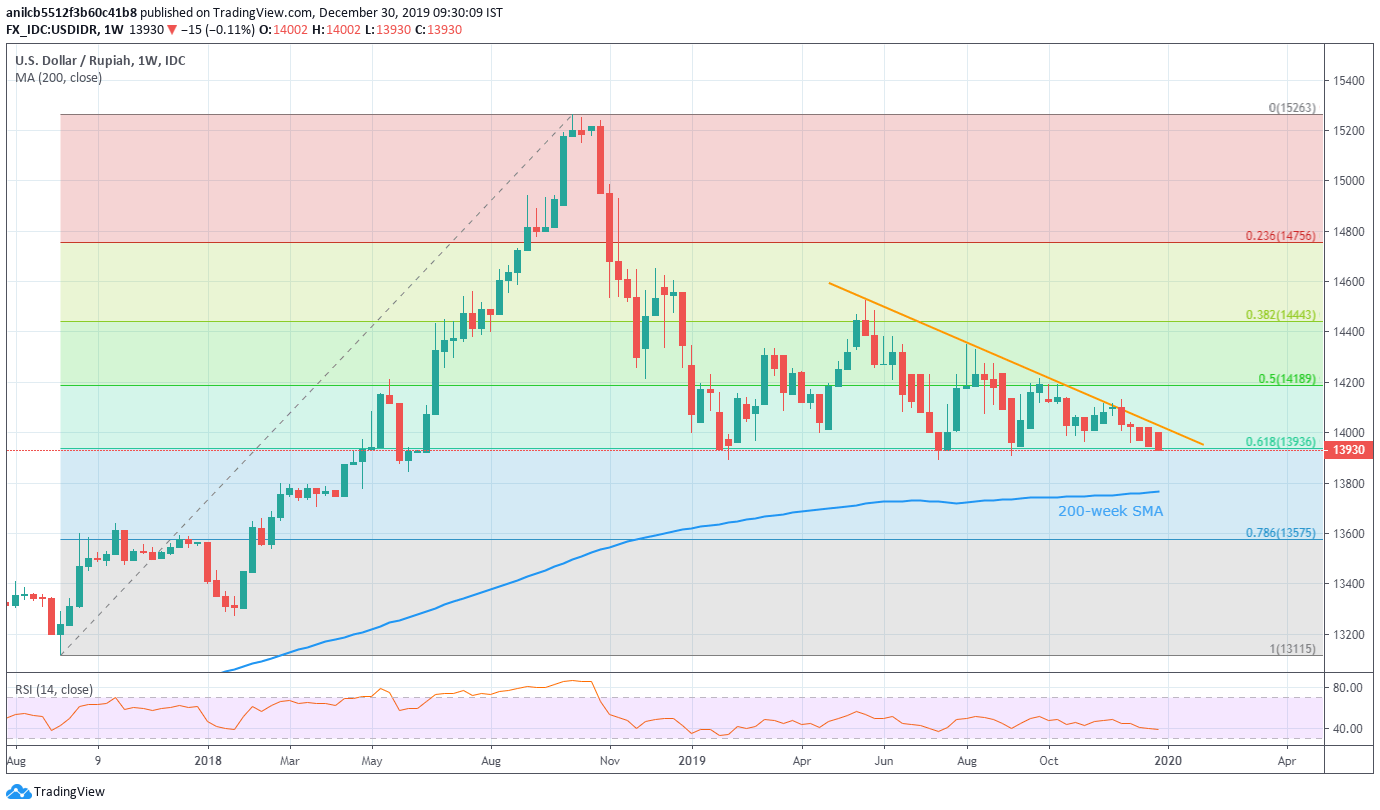
USD/IDR declines to the lowest since early-September, currently around 13,930, while heading into the European open on Monday. The pair tests 61.8% Fibonacci retracement of its 2017/18 rise. This support has triggered three bounces during the year, a failure to follow the suit can fetch the quote to 200-week Simple Moving Average (SMA).
Hence, sellers will look for a weekly closing below 13,936, comprising the key Fibonacci retracement level, to target a 200-week SMA level of 13,766.
However, lows marked in February and July, near 13,895, can offer an intermediate halt to the south-run.
If prices keep trading down after 200-week SMA, 78.6% Fibonacci retracement level of 13,575 could lure the bears.
On the upside, a clear crossing of the multi-week-old falling trend line, close to 14,045/50, can trigger a fresh rise towards a 50% Fibonacci retracement level of 14,189.
USD/IDR weekly chart
Trend: Bearish
