- USD/IDR has jumped to four-month highs and is currently trading above key resistance at 14,335.
- A close above 14,335 would strengthen the case for a rally to 200-day moving average resistance.
USD/IDR rose to 14,350 soon before press time, the highest level since January 4, amid escalating US-China trade tensions.
With the rise to multi-month highs, the bullish view put forward by the ascending 5- and 10-day moving averages (MAs) stands reinforced. Further, the 50-day MA has crossed the 100-day MA from below, confirming a bullish crossover.
As a result, the spot appears on track to test the 200-day moving average (MA), currently at 14,471. The bullish case would further strengthen if the spot closes today above the March 8 high of 14,355.
However, if the bullish close remains elusive, then the overbought readings on the 14-day relative strength index (RSI) would gain credence. In that case, the spot could revisit the 100-day MA support, currently at 13,948.
Daily chart
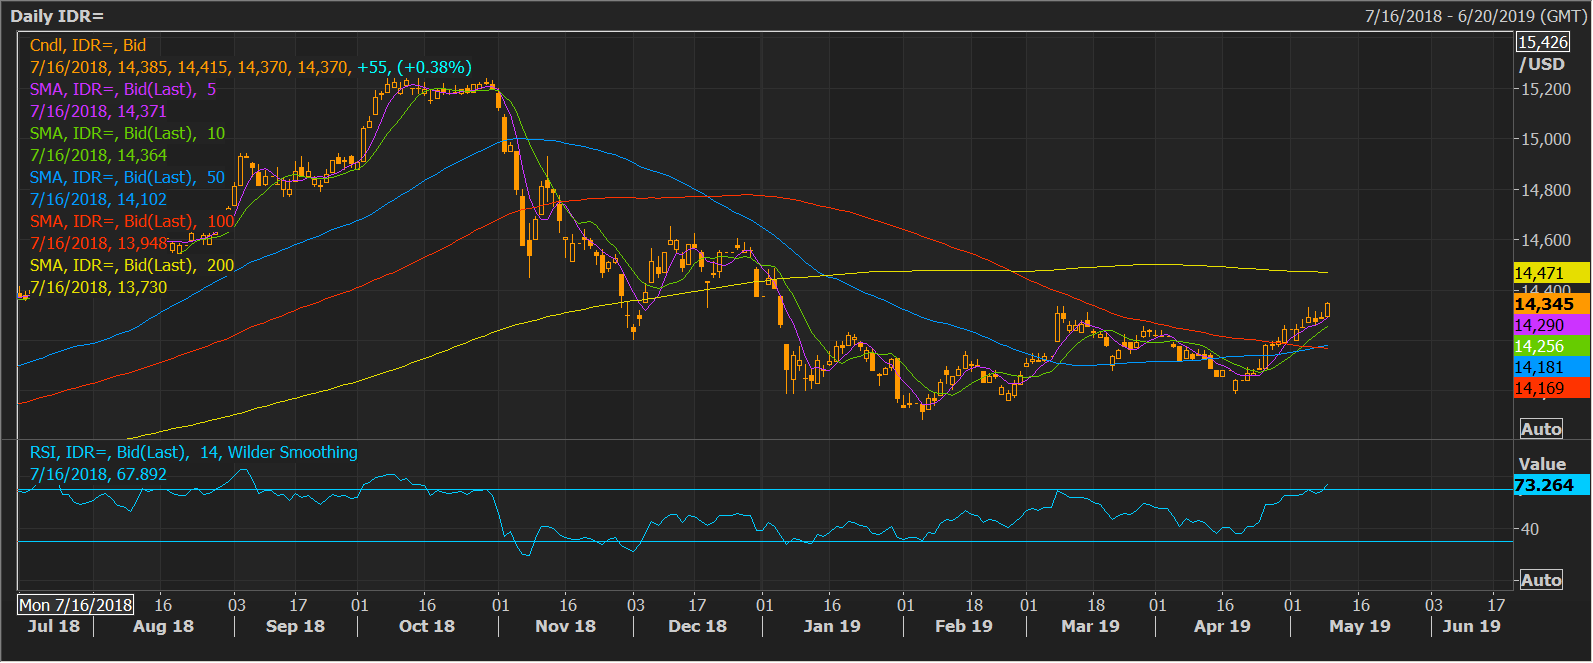
Trend: Bullish
Pivot points
