- USD/IDR seesaws near 38.2% Fibonacci retracement.
- 50-DMA and 23.6% Fibonacci retracement offers strong downside support.
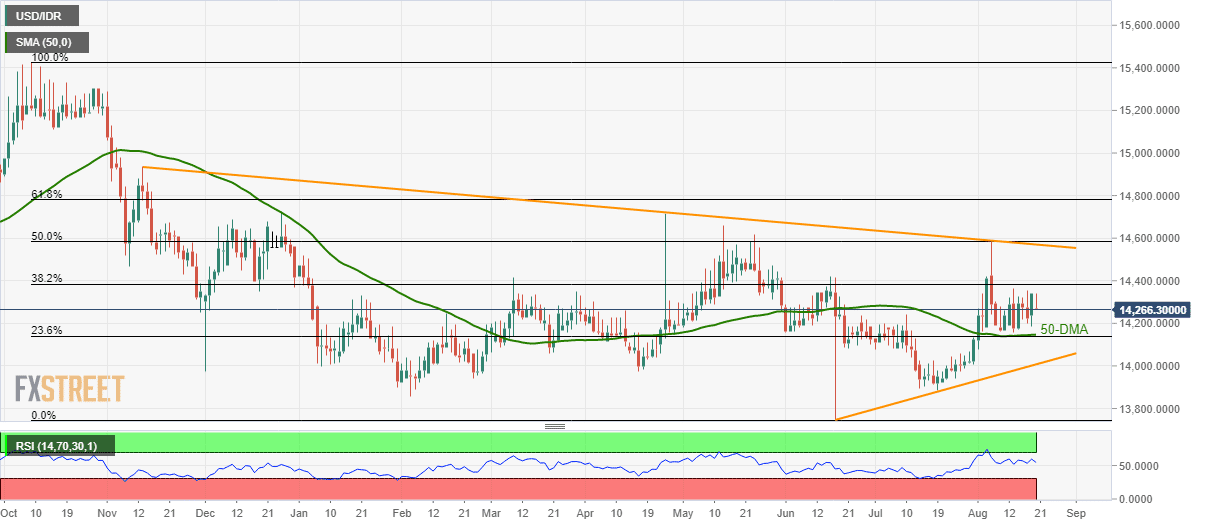
With its sustained trading beyond the key support confluence, the USD/IDR pair flashes 14,266 as a quote during early Tuesday.
Despite repeated failures to cross 38.2% Fibonacci retracement of 2018 swing high to 2019 swing low, prices remain firm unless closing below the 14,150/38 support confluence including 50-day simple moving average (DMA) and 23.6% Fibonacci retracement.
As a result, buyers can still target 38.2% Fibonacci retracement of 14,384, a break of which will trigger a fresh upside to 14,500 round-figure.
However, a downward sloping trend-line since November 2018 and 50% Fibonacci retracement, near 14,570 and 14,582 respectively, will question buyers.
On the contrary, pair’s dip beneath 14,138 will target three-month-old support-line at 14,000.
USD/IDR daily chart
Trend: Bullish
