- USD/INR broke below the bear flag pattern and the 71.20 support level.
- Downside target can be located near the 70.40 level.
USD/INR weekly chart
USD/INR is trading above the main weekly simple moving averages (SMAs). After the 2018 bull-market, the spot has been consolidating in a rectangle formation.

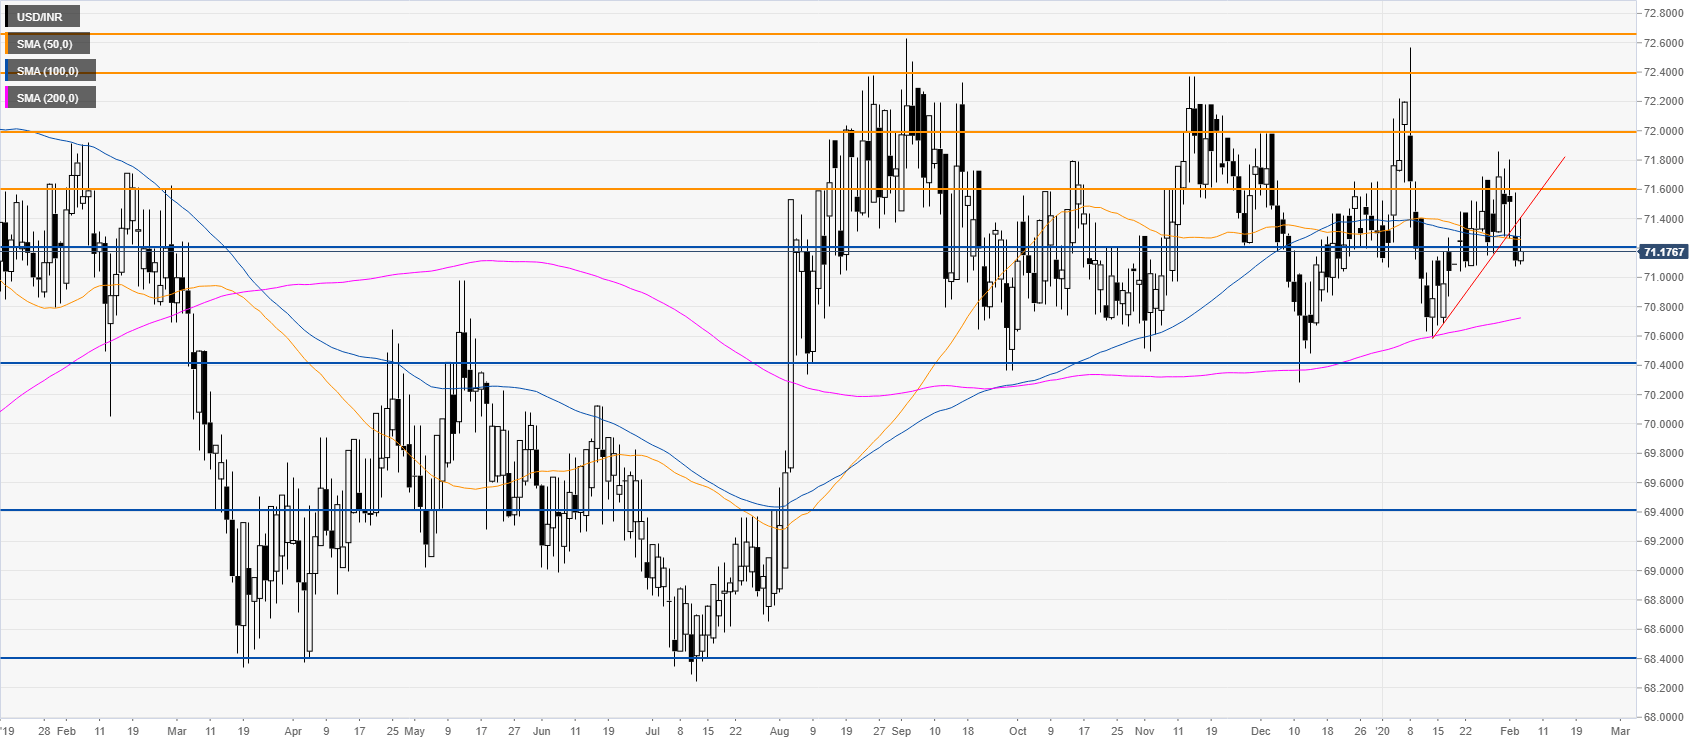
USD/INR daily chart
The spot is breaking below a bear flag pattern below the 71.20 support level, suggesting that USD/INR could potentially weaken to the 70.40 price level. The 71.20 support has become resistance. Further up lies the 71.60 resistance level.
Additional key levels
