- USD/INR witnesses pullback moves amid the latest US dollar weakness.
- September 2019 high could please the bears, an ascending trend line from August 2013 could lure the bulls.
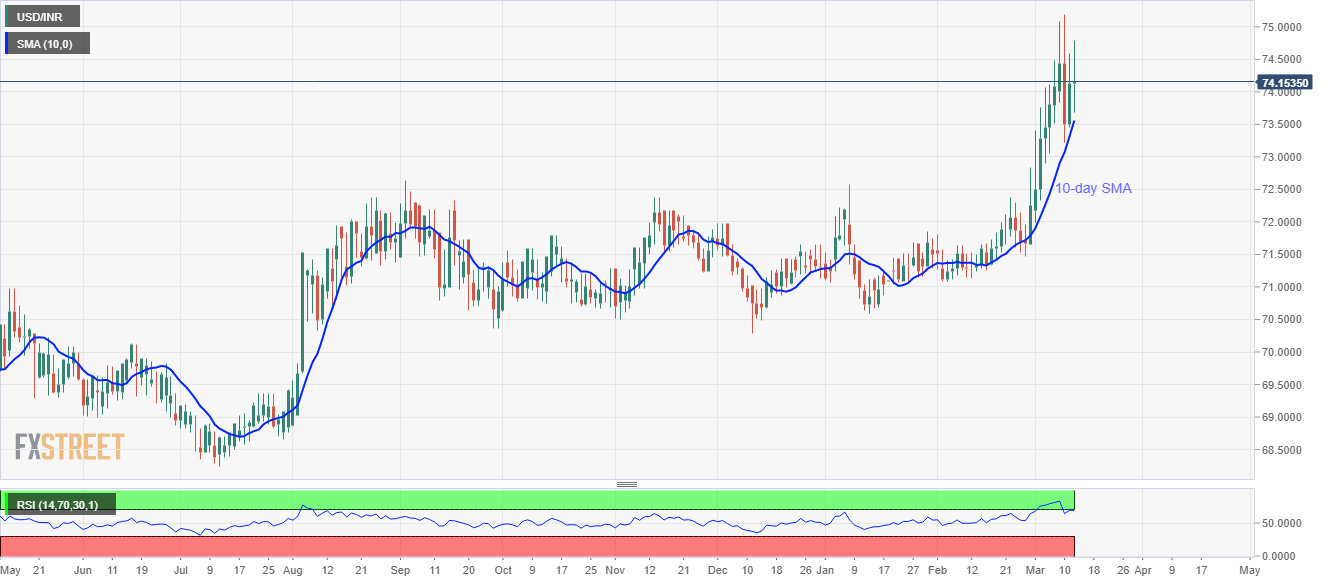
- Overbought RSI favors the long liquidation.
With the USD/INR traders jostling amid broad US dollar weakness and sustained trading beyond 10-day SMA, the quote marks no major change to 74.13 during the initial Indian session on Thursday.
Looking at the overbought conditions of RSI, the USD/INR prices are likely to witness a pullback towards September 2019 top near 72.63.
However, a daily close beyond a 10-day SMA level of 73.56 as well as sustained trading below 73.00 becomes pre-requisite for the same.
On the upside, buyers will wait for a clear break of 74.50 to aim for the latest multi-year high near 75.20.
In a case where the bulls dominate beyond 75.20, an ascending trend line connecting highs marked during August 2013 and October 2018, around 76.90 can grab the market’s attention.
USD/INR daily chart
Trend: Bullish
