- USD/INR extends pullback from a six-week-old ascending trend channel.
- A confluence of 50/100-day SMAs and the channel’s support-line can question the bears.
- Multiple upside barriers stay ready to probe the bulls on their return.
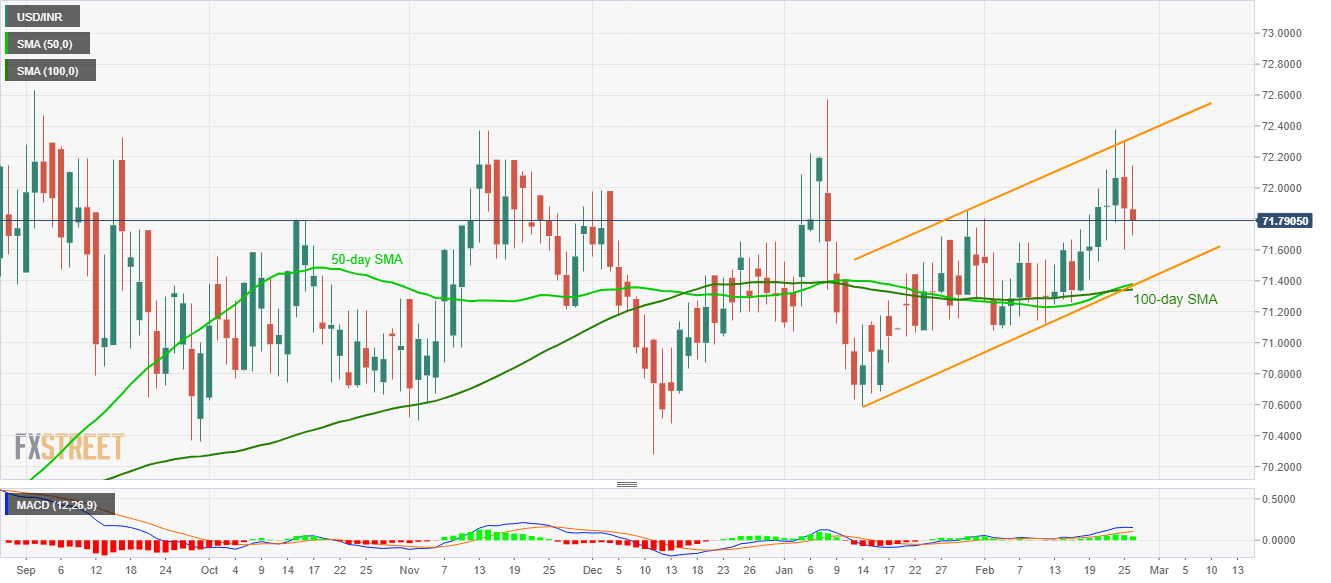
USD/INR stays on the back foot while losing 0.13% to 71.76 as the Indian session begins for Wednesday’s trading. The pair took a U-turn from an early-January high on Monday. The same portrays the quote’s pullback moves from a short-term rising channel formation.
That said, the USD/INR prices are now declining towards 71.60. However, a confluence of 50/100-day SMAs and support line of the aforementioned channel, around 71.40/35, will tame the bears afterward.
If not, then the return of 71.00 and the January 14 low near 70.60 can’t be ruled out.
Alternatively, 72.00 and the channel’s resistance near 72.33 will be the key to watch during the pair’s fresh recovery.
Even if the buyers manage to cross 72.33, January month high surrounding 72.57 and September 2019 top near 72.63 will be the key to watch.
USD/INR daily chart
Trend: Pullback expected
