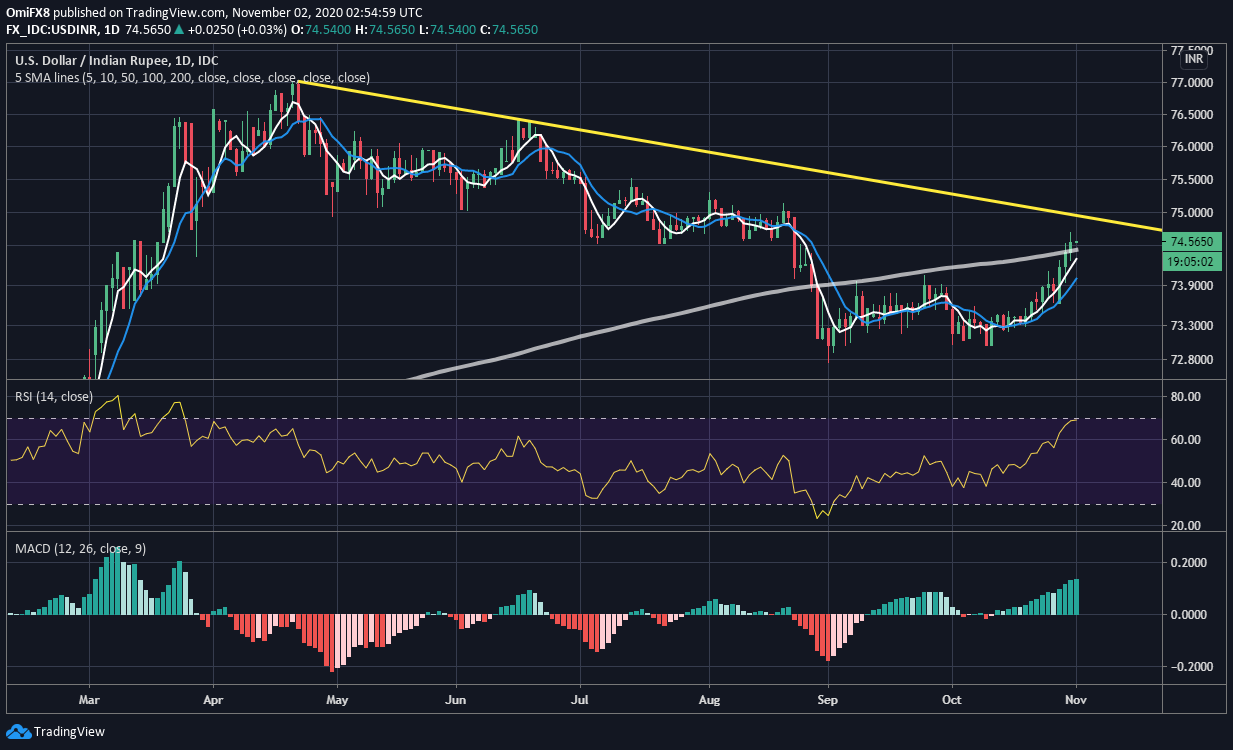
- USD/INR has flipped the 200-day SMA into support.
- The breakout has exposed resistance of trendline falling from April highs.
Having found acceptance above a key hurdle, USD/INR now looks set to challenge the trendline falling from April and June highs.
The pair jumped over 1% last month and closed well above the widely-tracked 200-day simple moving average (SMA).
The breakout is backed by ascending 5- and 10-day SMAs and an above-50 or bullish reading on the 14-day relative strength index. Further, the bullish momentum looks strong, as the MACD histogram is printing bigger bars above the zero line.
As such, the odds appear stacked in favor of a rally to the descending trendline, currently at 74.95. The pair may witness a minor pullback before rallying to the major trendline resistance. That’s because the hourly and 4-hour chart indicators are suggesting overbought conditions.
The bullish bias would be invalidated if the pair finds acceptance under the 10-day SMA at 74.00.
Daily chart
Trend: Bullish
Technical levels
